Indicators
Updated:
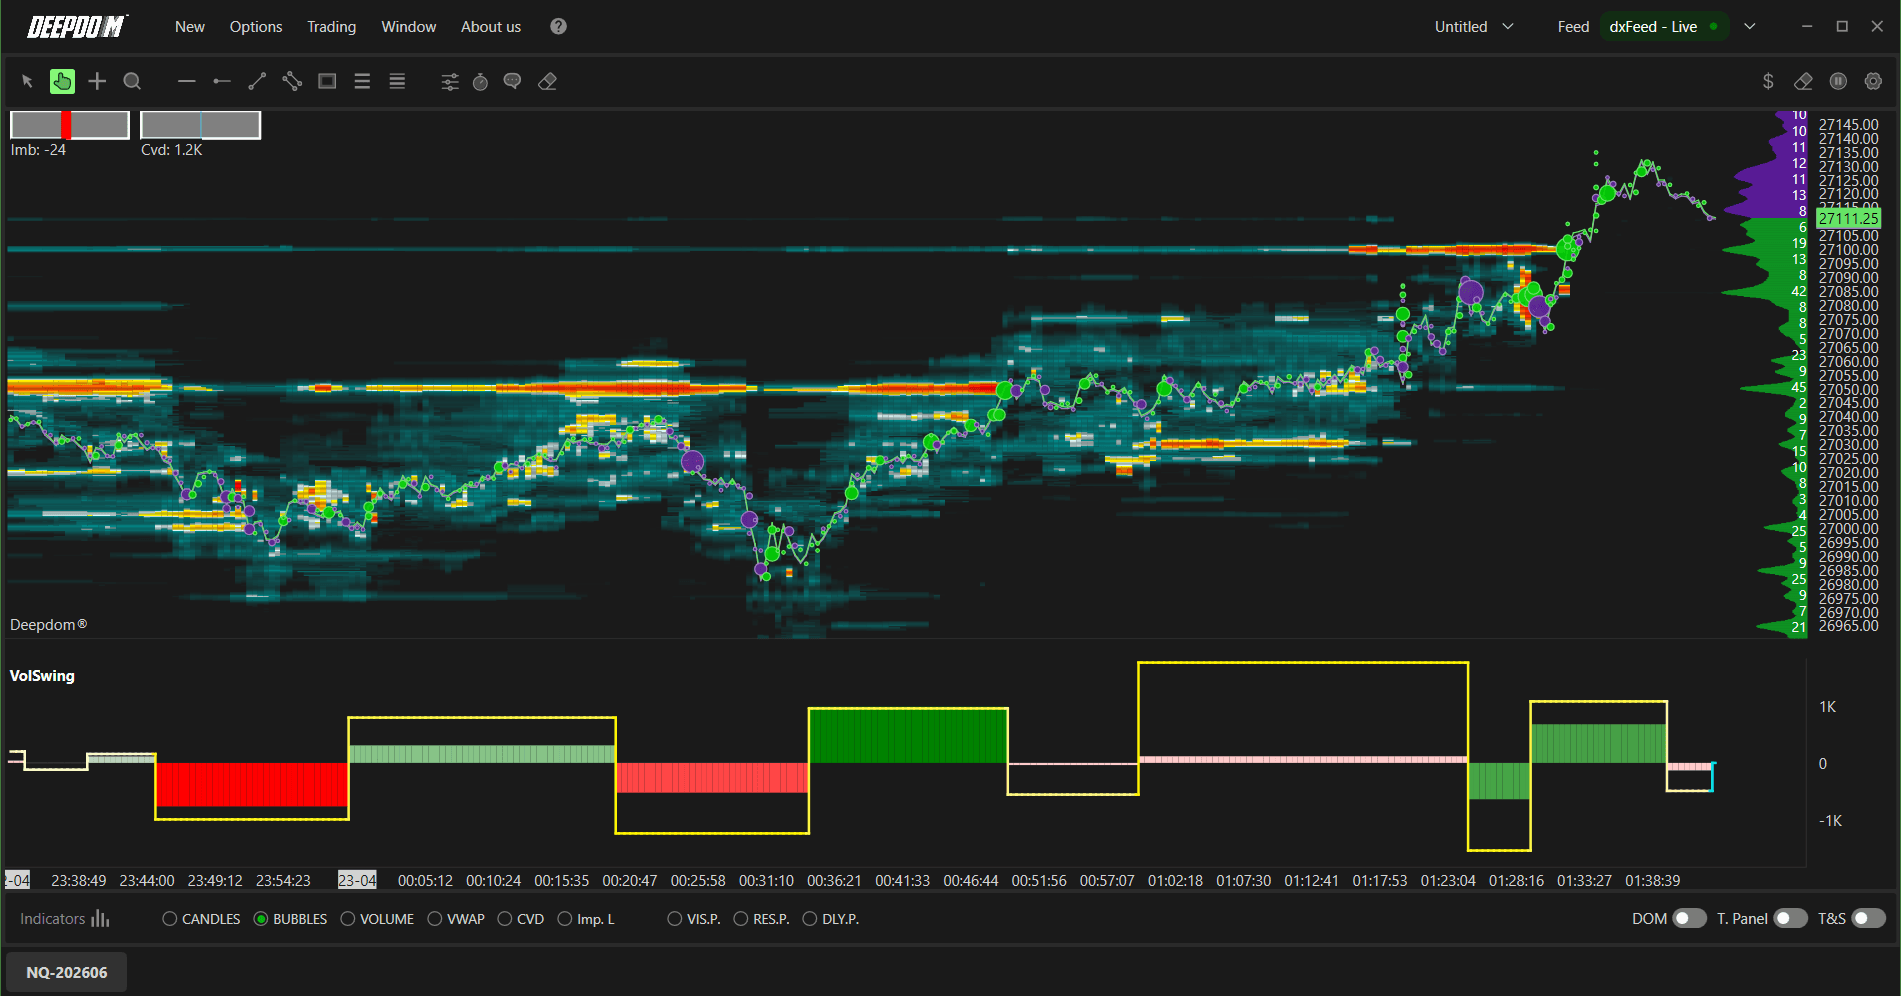
Volume Swing is a comprehensive tool that combines volume analysis with swing and trend analysis, giving you a deeper understanding of market structure and critical turning points. By enhancing Price Action behavior with volumetric data, it is ideal for traders who want detailed visualization and advanced control over market conditions.
Note: Volume Swing is also available on DeepCharts with additional functionality. For more details, refer to the Volume Swing article on DeepCharts.
How to Set Up Volume Swing
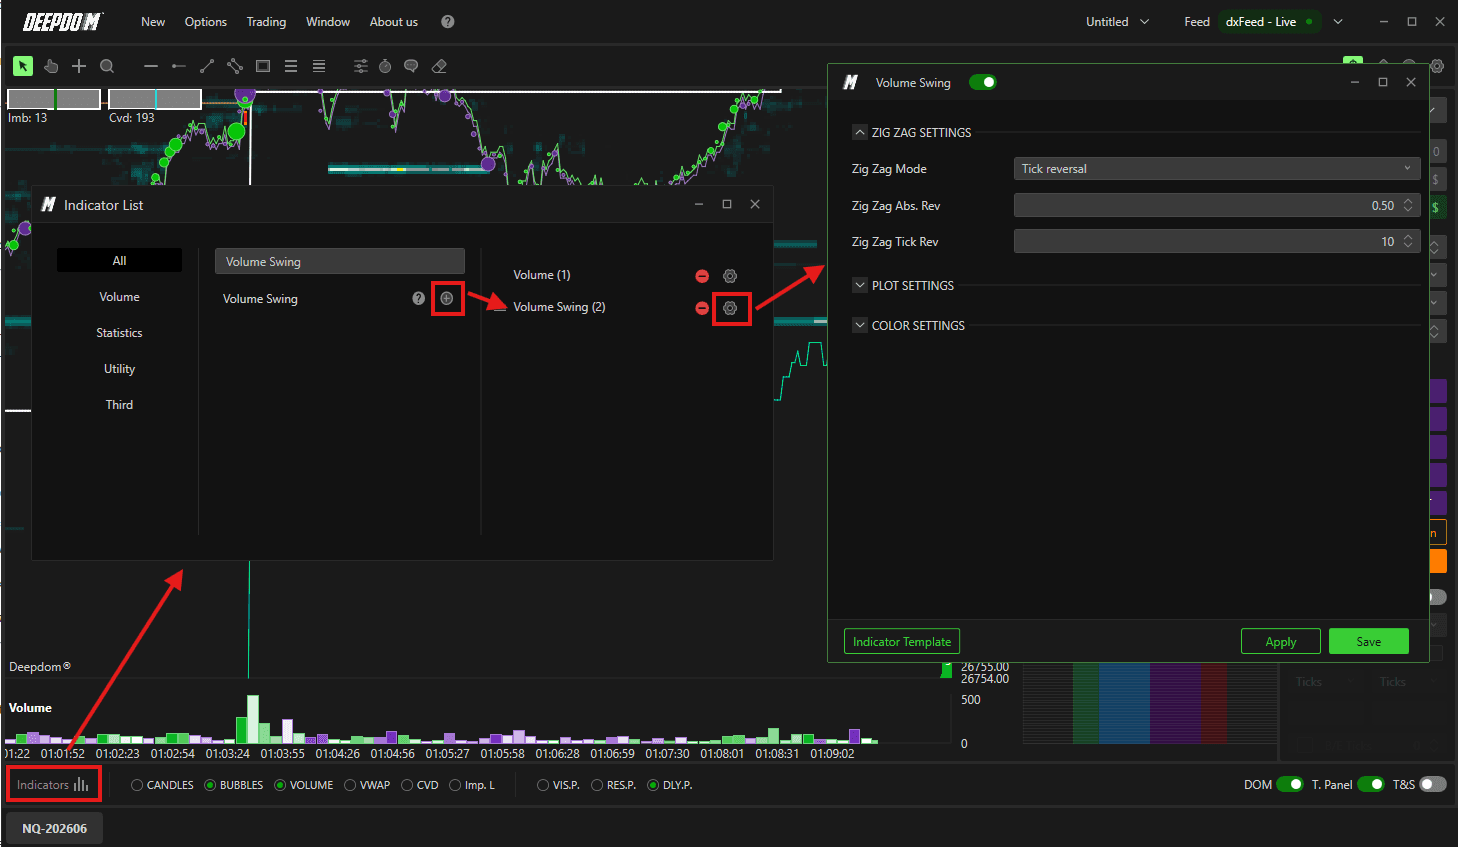
Click the Indicators icon on the chart
Find Volume Swing in the list and click + to add it
Click the settings icon on the indicator to open its configuration window
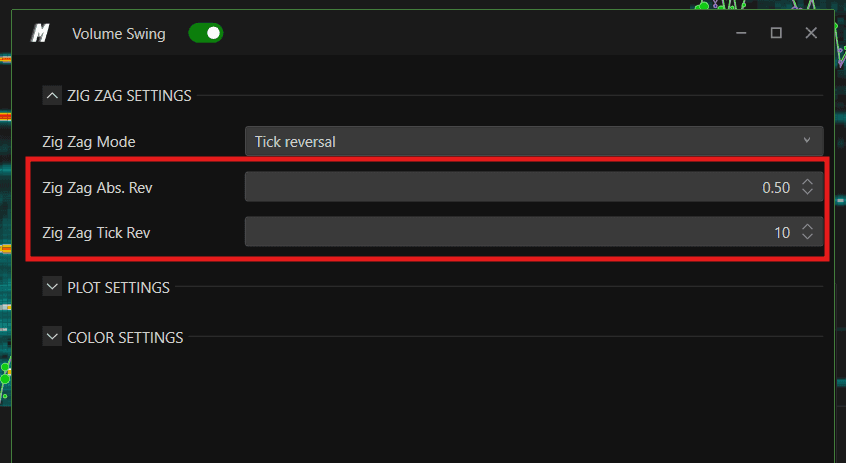
Zig Zag Settings
What is the Zig Zag? The Zig Zag defines the swing structure — the series of price movements that trace highs and lows across the chart. Volume Swing uses this swing structure as the basis for all of its volume calculations. In simple terms, it determines what counts as a meaningful price move before a new swing is drawn.
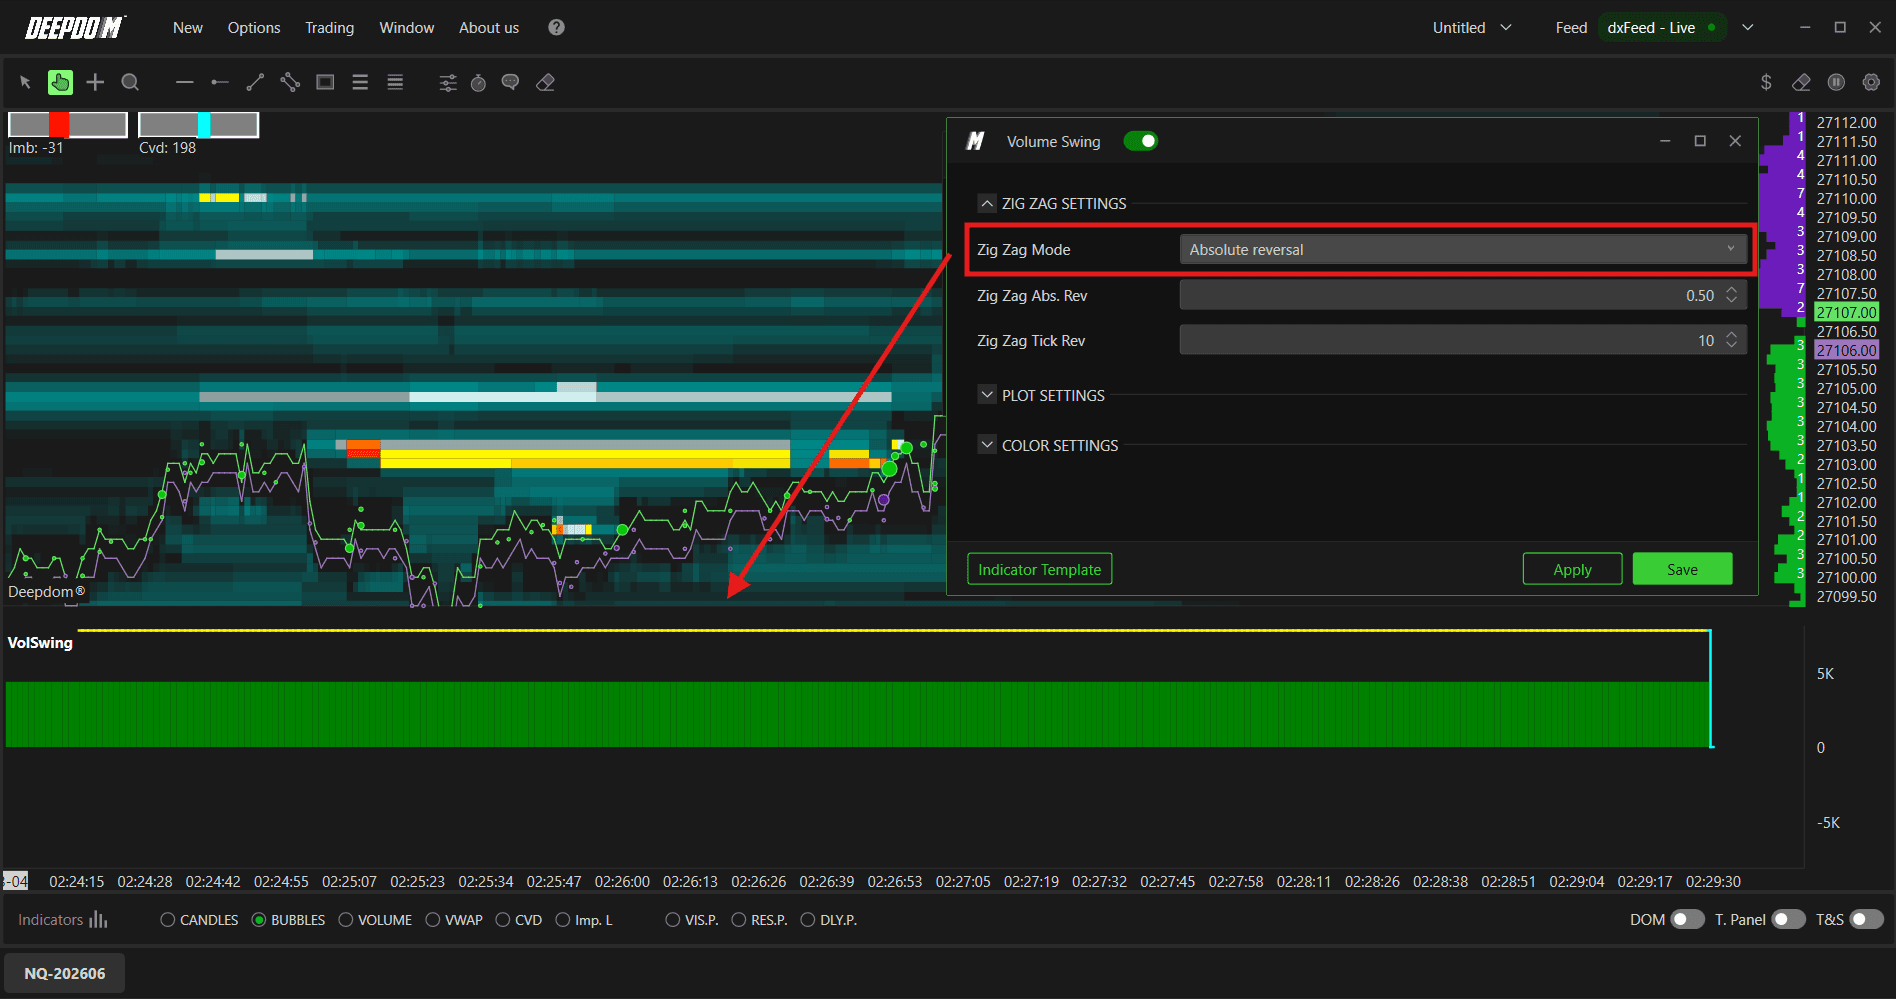
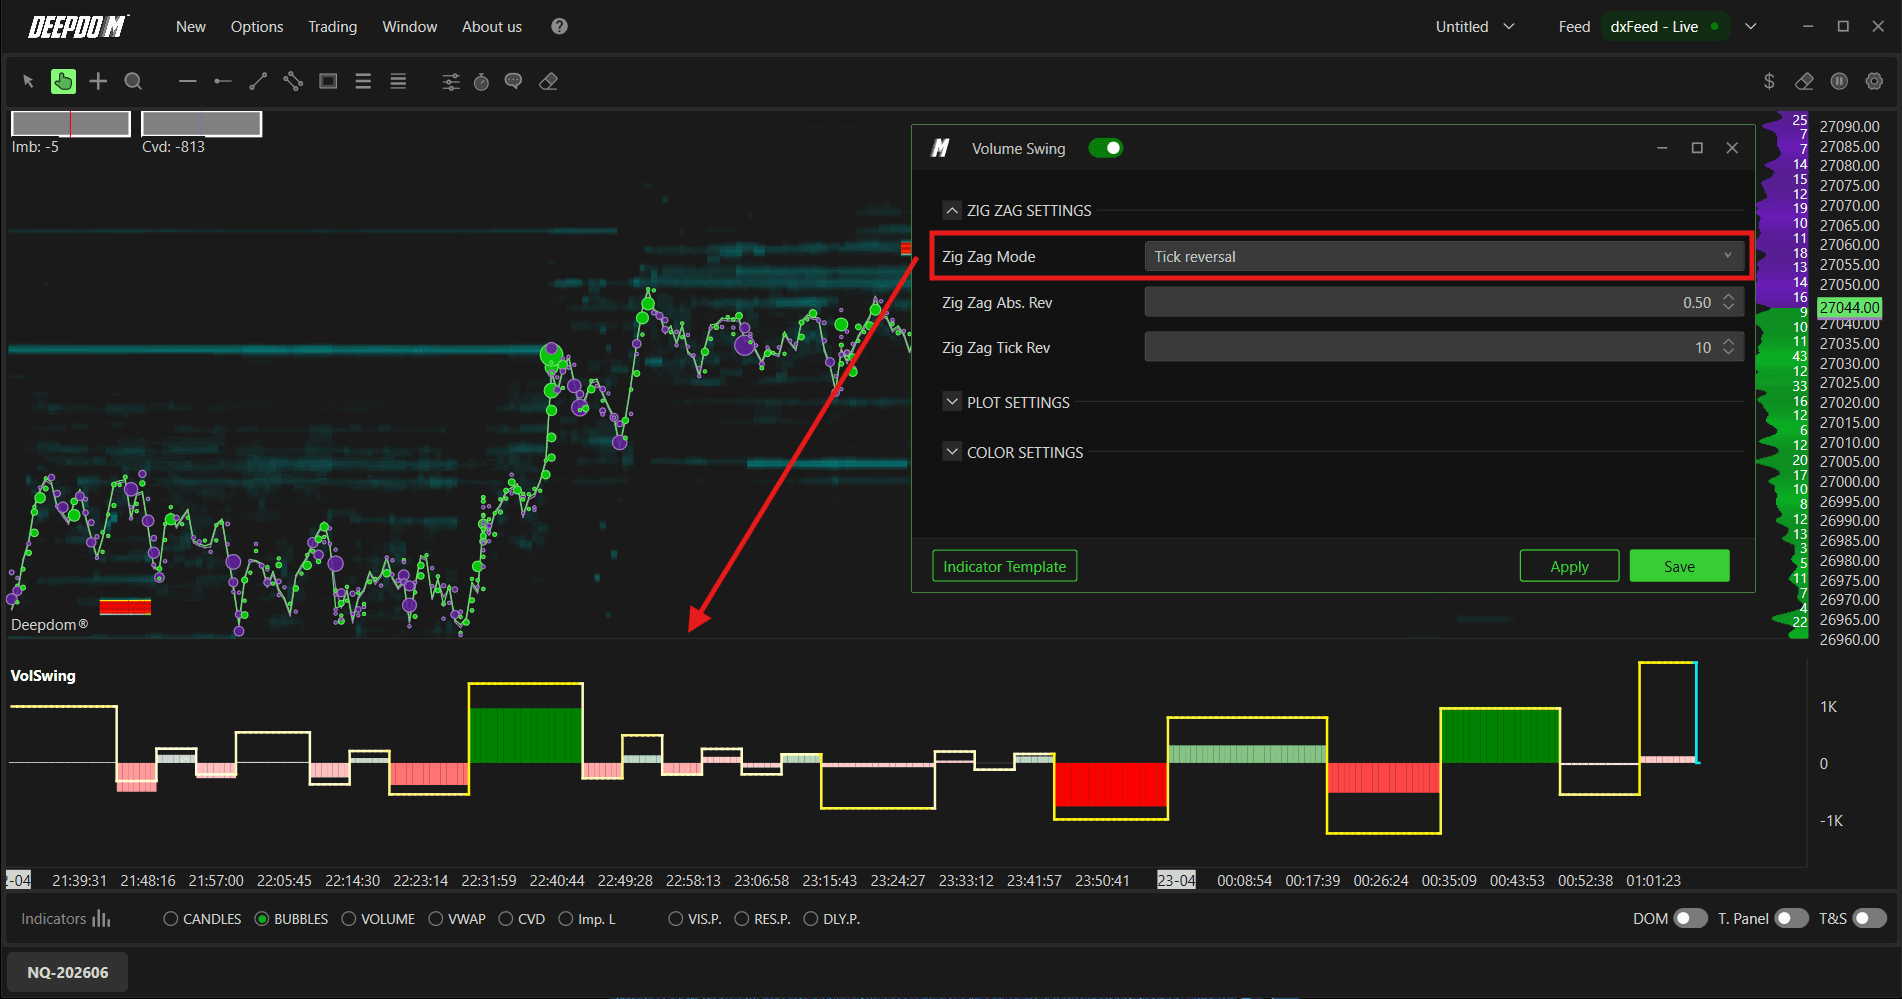
1. Zig Zag Mode Selects the method used to calculate swings. You can choose between:
Absolute Reversal — a swing is defined by a fixed price reversal value. Price must move a sufficient amount in the opposite direction from the current trend to confirm a new swing
Tick Reversal — a swing is defined by a minimum number of ticks moving in the opposite direction
2. Zig Zag Rev. & Absolute Sets the minimum percentage change required for price to define a new swing. This controls how sensitive the indicator is — a higher value means only larger moves will generate a new swing, while a lower value will draw swings more frequently.
3. Zig Zag Tick Rev. When using Reversal Tick mode, this defines the exact number of ticks required to confirm a reversal and draw a new swing.
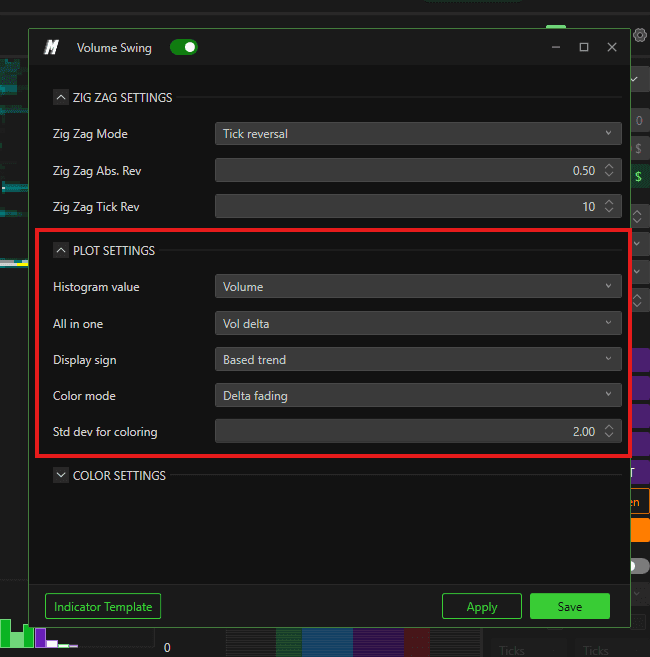
Plot Settings
1. Histogram Value Selects which volumetric data is displayed in the bar histogram beneath each swing. Options include:
Volume - show the total volume
Volume Delta — the difference between buying and selling volume
Delta Trade — the difference between buy and sell trades
Vol Per Tick — the average volume per tick within the swing
Extension — the size of the price move expressed in number of ticks
2. All-in-One Combines multiple volumetric data points into a single visual element on the chart. Options include:
None — no combination, each element displayed separately
Vol Delta Trade — combines volume and delta trade data
Vol Delta — shows volume and delta together
Volume — displays volume data only
3. Display Sign Defines how the positive or negative sign is interpreted for the indicator coloring. Options include:
Positive — coloring based on positive values only
Negative — coloring based on negative values only
Based Delta — coloring driven by the volume delta
Based Trend — coloring driven by the direction of price movement
4. Color Mode Selects how colors are applied across the histogram. Options include:
Fixed — a single uniform color used throughout
Fade — colors gradually fade based on value intensity
Delta Fade — fade is driven by delta values, making shifts in buying or selling pressure more visually obvious
5. Std. Dev. for Coloring Sets the standard deviation threshold used to color the data. A higher value reduces color sensitivity to volumetric changes, while a lower value makes the coloring react more readily to smaller shifts in volume.
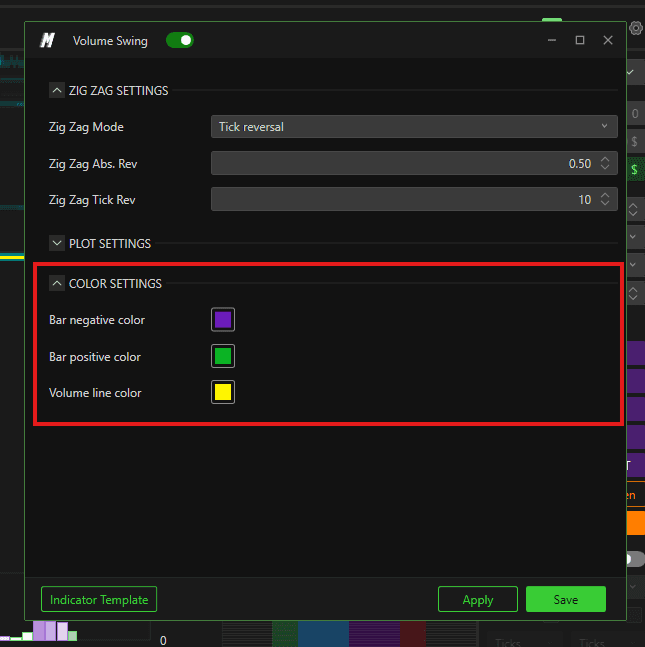
Color Settings
Bar Negative Color The color used to represent bars with negative values in the histogram — typically indicating selling pressure dominance.
Bar Positive Color The color used to represent bars with positive values in the histogram — typically indicating buying pressure dominance.
Volume Line Color The color used for the volume line overlay, allowing you to visually distinguish volume trends associated with each swing movement.
Conclusion
Volume Swing brings together swing structure and volume data in a single indicator, making it easier to read the strength behind each market move. Whether you are identifying trend continuations or potential reversals, the combination of Zig Zag swing detection and volumetric histograms gives you a more complete picture than price alone.
For additional functionality and a more in-depth explanation, visit the Volume Swing article on DeepCharts.
Still Having Trouble?
Our support team is available 24/7 and ready to help you with any issue you encounter.
When reaching out, please include:
A screenshot of the issue
A brief description of what you were trying to do
Support Ticket (Fastest Response) Visit www.deepcharts.com and create a support ticket directly on our website.
Email Support Reach us at support@deepcharts.com — please note that email responses may take a little longer than a support ticket.