Indicators
Updated:
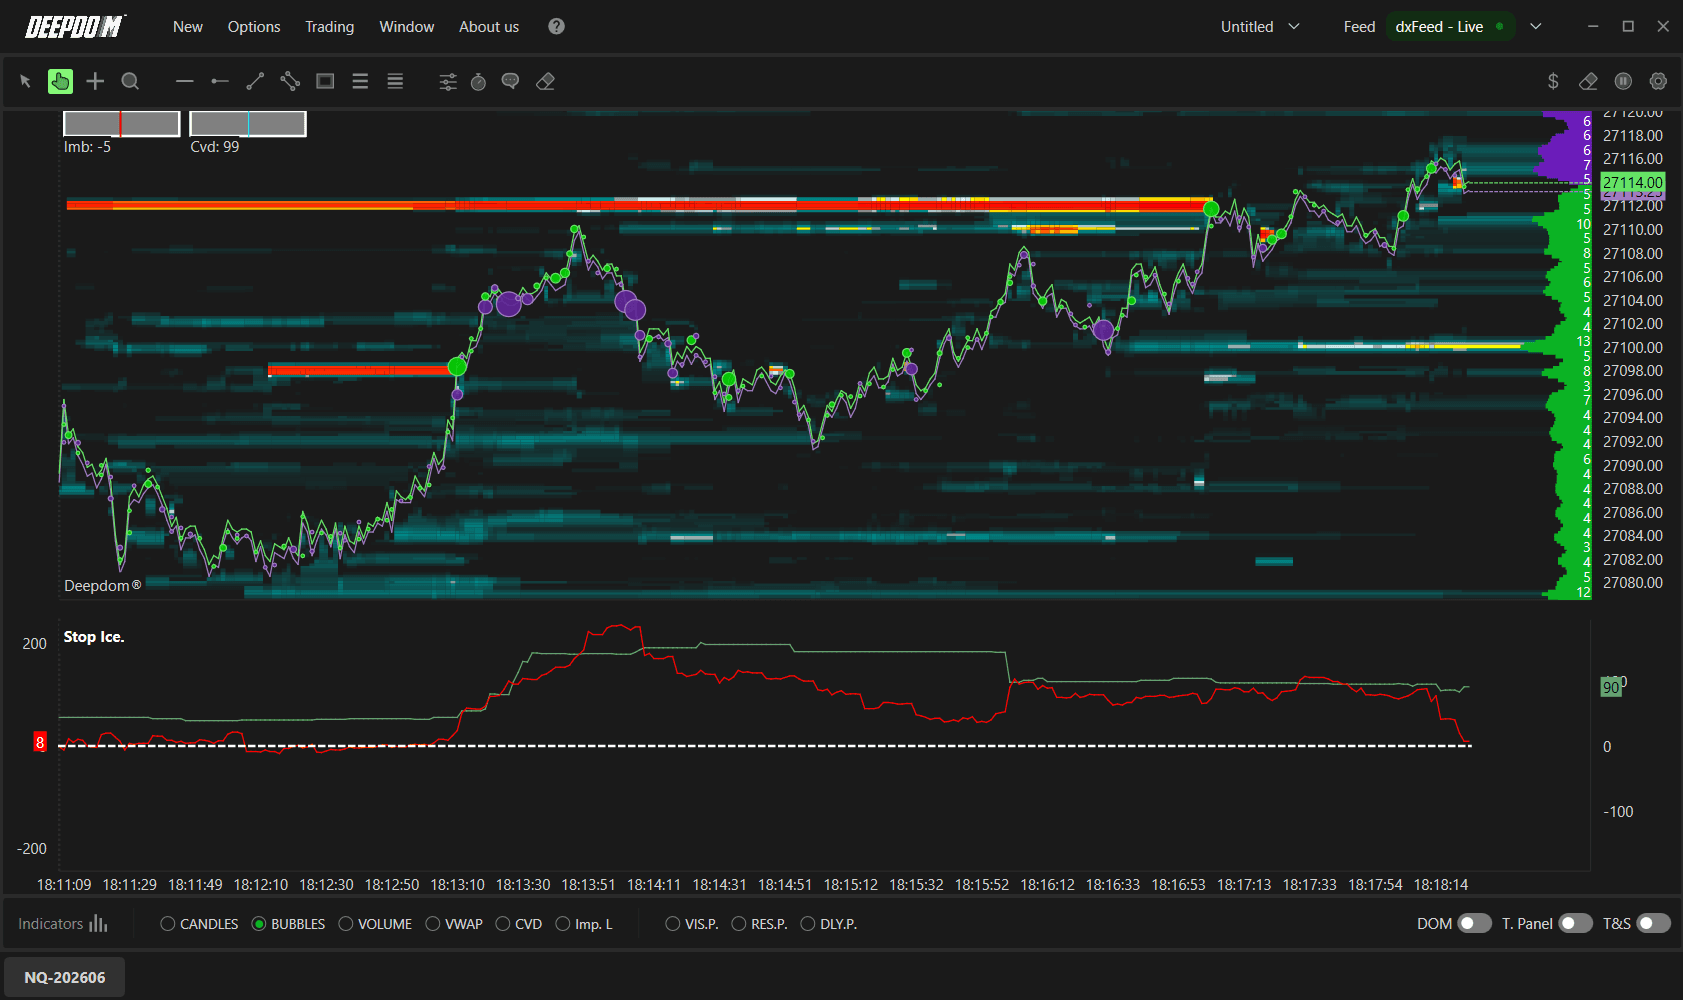
The Stop Iceberg indicator monitors and identifies two specific types of market activity — Iceberg orders and Stop orders — using MBO (Market By Order) technology. It tracks the presence and execution of these orders in real time, showing how they influence price movement and helping you understand where significant hidden activity may be taking place.
What is an Iceberg Order?
An Iceberg order is a large buy or sell order that is deliberately split into smaller visible portions to hide its true size from the market. Only a small part — the "tip" — is visible in the order book at any time. Once the visible portion is executed, the hidden remainder gradually enters the market.
Think of it this way — imagine a large institution wants to buy 10,000 contracts of NQ. If they placed the entire order at once, every trader watching the order book would immediately see it, prices would move against them, and their average entry price would get worse. Instead, they break it into smaller pieces — showing only 50 contracts at a time in the book. Each time those 50 contracts are bought, another 50 appear — making it look like normal market activity while they quietly fill their large position.
There are two types of Iceberg orders:
Native Iceberg Order Supported directly by the exchange's matching engine. The exchange itself manages the visible and hidden portions, gradually revealing volume as the visible tip is consumed. These can be identified using MBO data.
Synthetic Iceberg Order Created by external trading software that breaks a large order into several smaller orders and feeds them progressively into the book. These are not handled by the exchange and cannot be identified through MBO — they appear indistinguishable from regular orders.
What is MBO (Market By Order)? MBO is a technology that gives you detailed, order-level data from the book — including each order's identifier, initial quantity, remaining volume, and execution status. This level of detail makes it possible to spot the characteristic "reloading" behavior of Iceberg orders — where a new visible portion keeps appearing each time the previous one is fully executed. MBO can identify Native Iceberg orders but not Synthetic ones.
What is a Stop Order?
A stop order is an instruction that automatically triggers a market order when price reaches a specific level. Traders use them in two main ways — to protect an open position from a large loss, or to enter the market when price breaks through a key level.
For example — a trader is long NQ from 26,800 and places a stop order at 26,750. If price drops to 26,750, their position closes automatically — limiting their loss without them needing to watch the screen constantly.
With data feeds such as Rithmic (Market Depth), DeepDom can reconstruct and quantify Stop orders using proprietary algorithms. When price reaches a level where many Stop orders are accumulated, they can all trigger simultaneously — generating a significant spike in volume and potentially causing a fast continuation or reversal of the move.
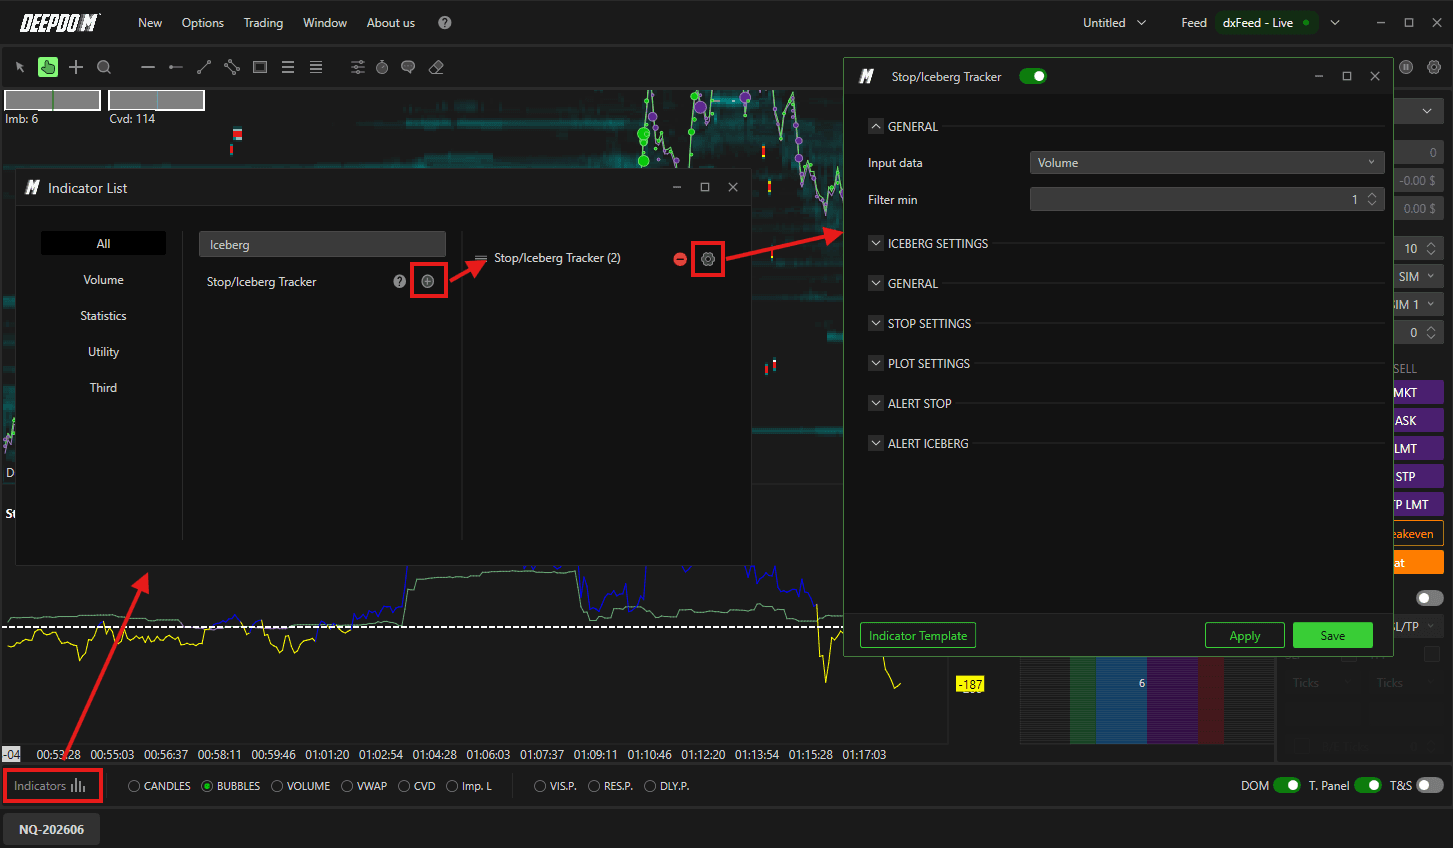
How to Set Up the Stop Iceberg Indicator
Click the Indicators icon on the chart
Find Stop Iceberg in the list and click + to add it
Click the settings icon on the indicator to open its configuration window
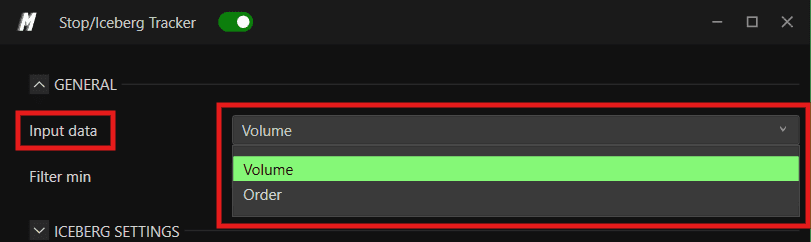
General Settings
Input Data Select the type of data the indicator uses for its calculations:
Volume — based on the volume of orders
Order — based on the number of individual orders
Examples -
Input Data - By Volume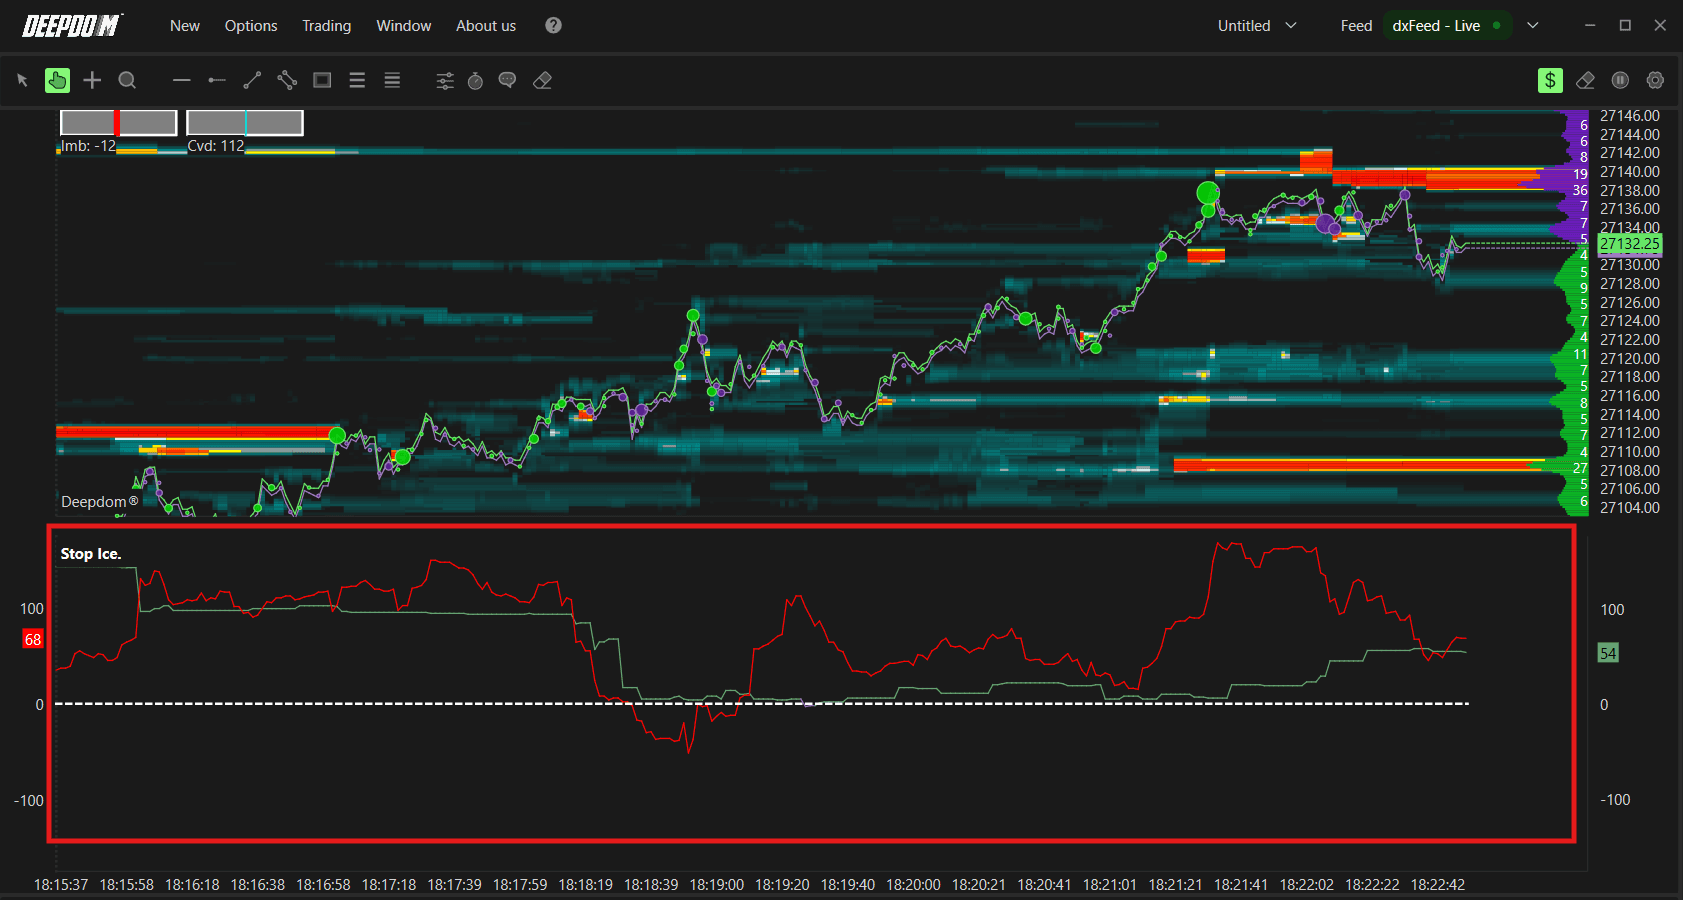
Input Data - By Order
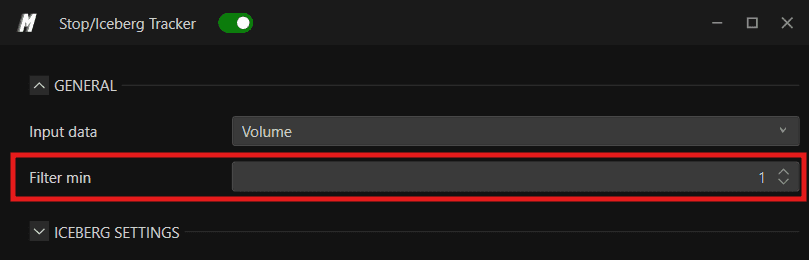
Filter Minimum Sets the minimum volume or number of orders required for an event to be considered relevant. This filters out insignificant activity and focuses the indicator on meaningful order flow.
Examples -
Filter Minimum - By 1
Filter Minimum - By 10
Filter Maximum Sets the maximum volume or number of orders to be included in the calculation. Useful for excluding outlier events from the display.
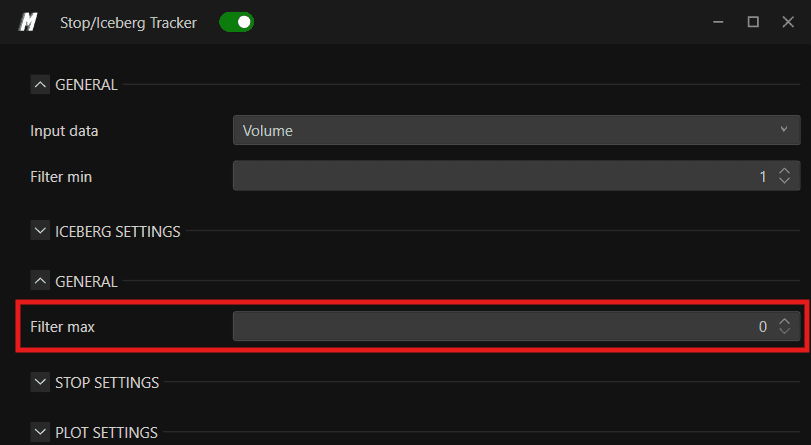
Examples -
Filter Max - By 0
Filter Max - By 10
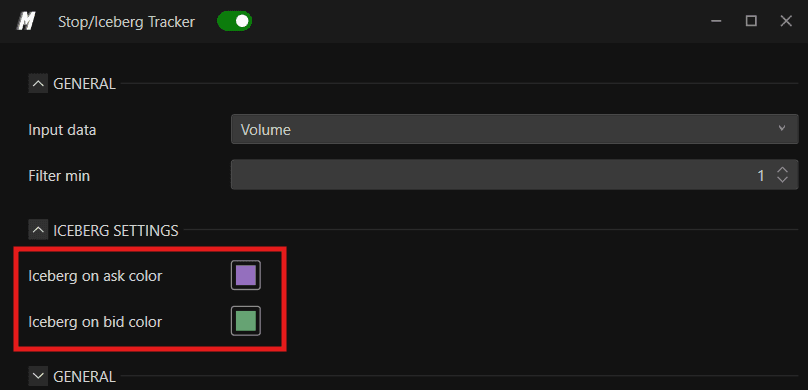
Iceberg Settings
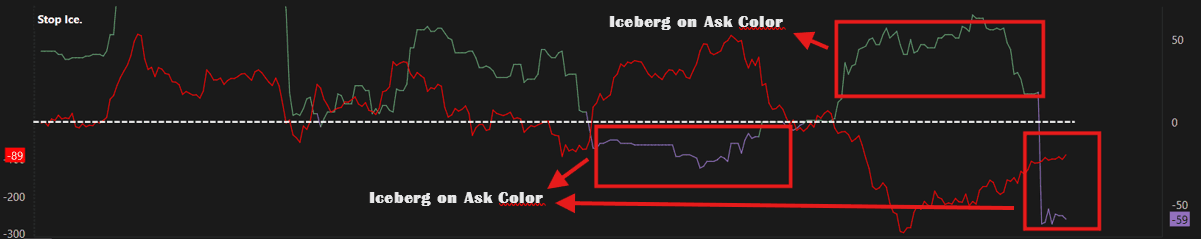
Iceberg Ask Color Sets the color used to identify Iceberg orders on the Ask (sell) side of the market.
Iceberg Bid Color Sets the color used to identify Iceberg orders on the Bid (buy) side of the market.
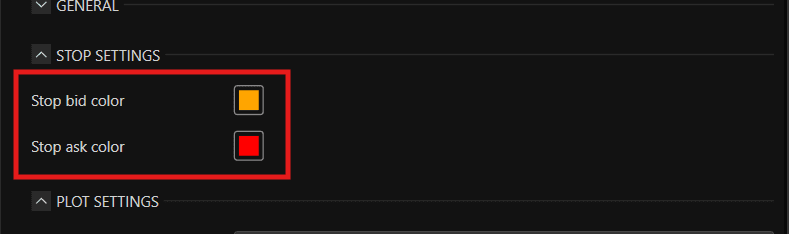
Stop Settings
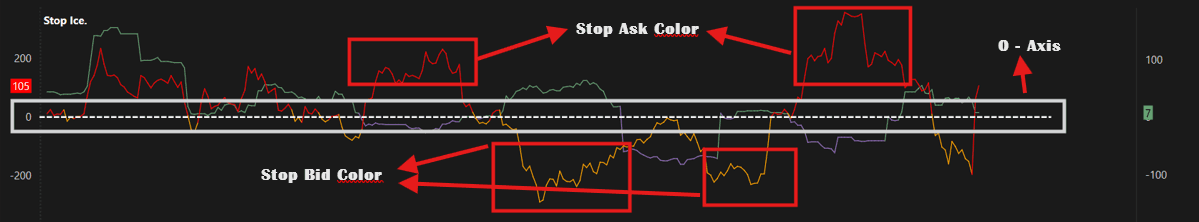
Stop Bid Color Sets the color used to display Stop orders triggered on the buy side.
Stop Ask Color Sets the color used to display Stop orders triggered on the sell side.
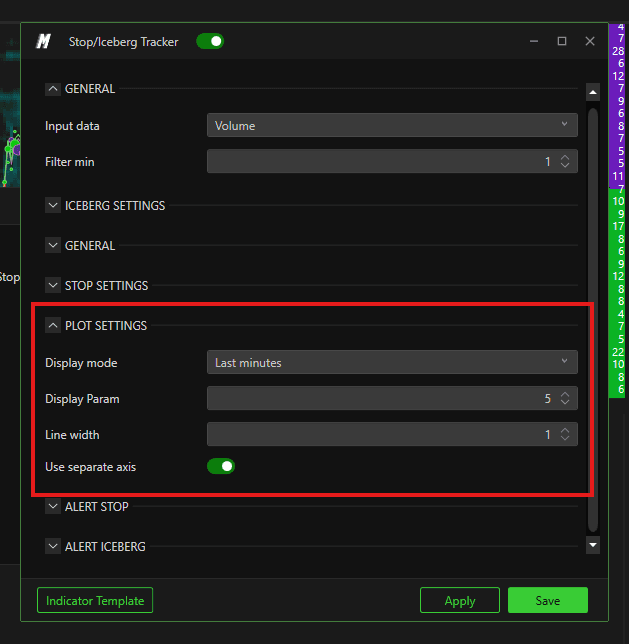
Plot Settings
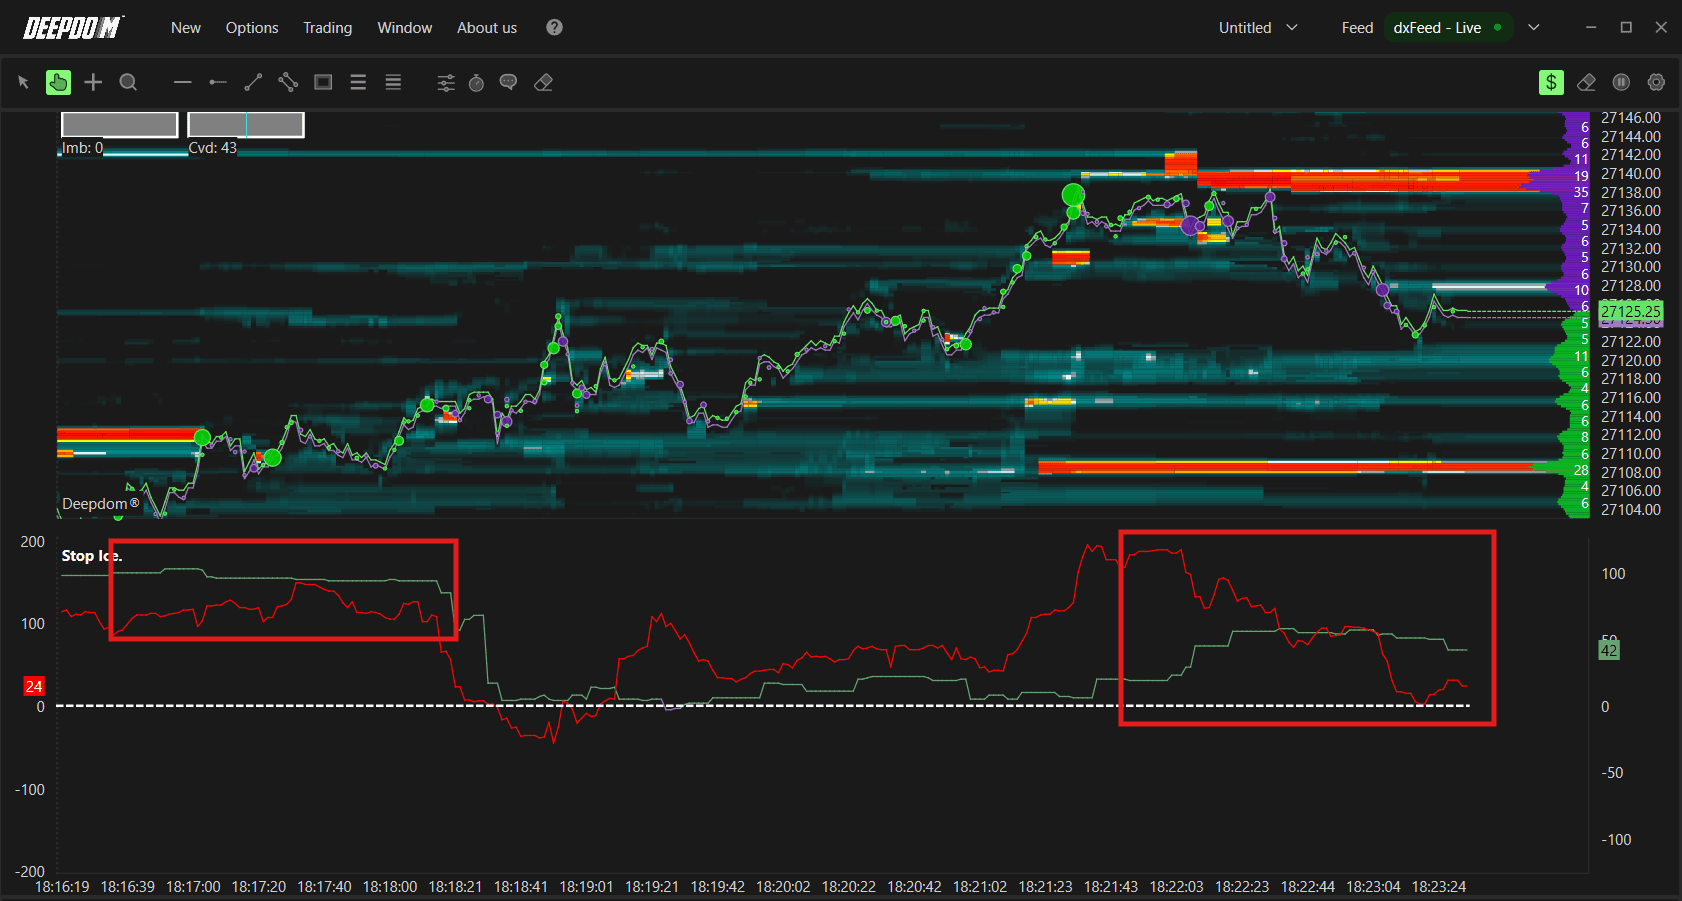
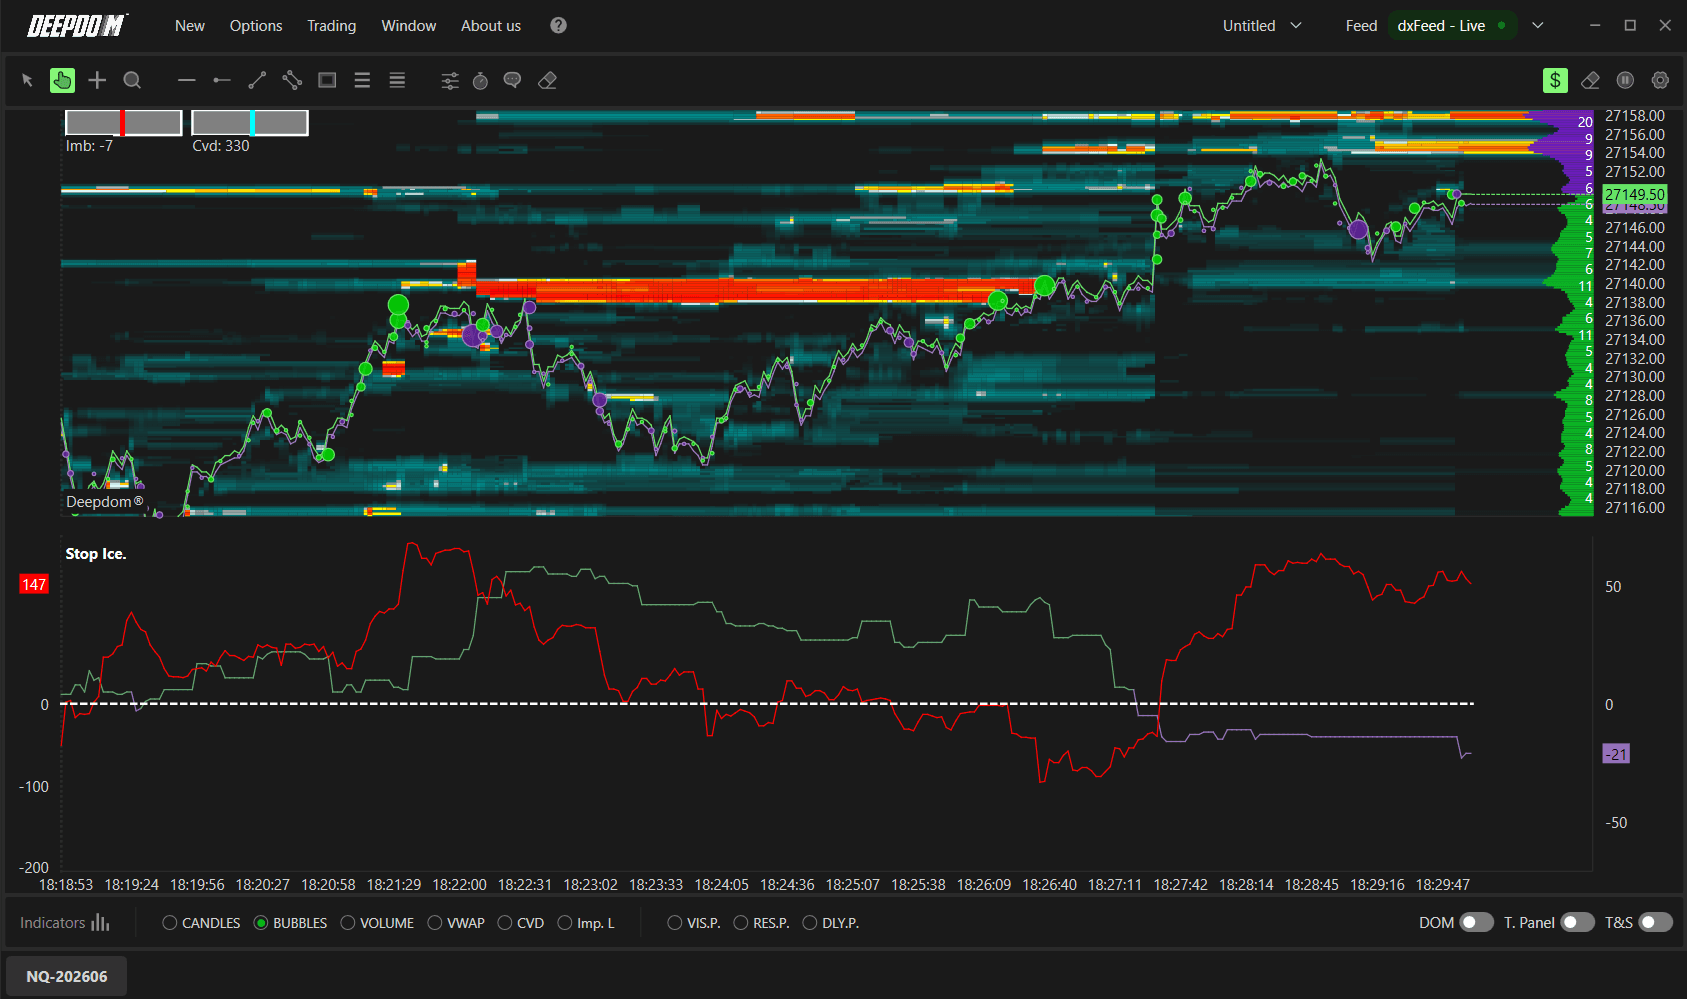
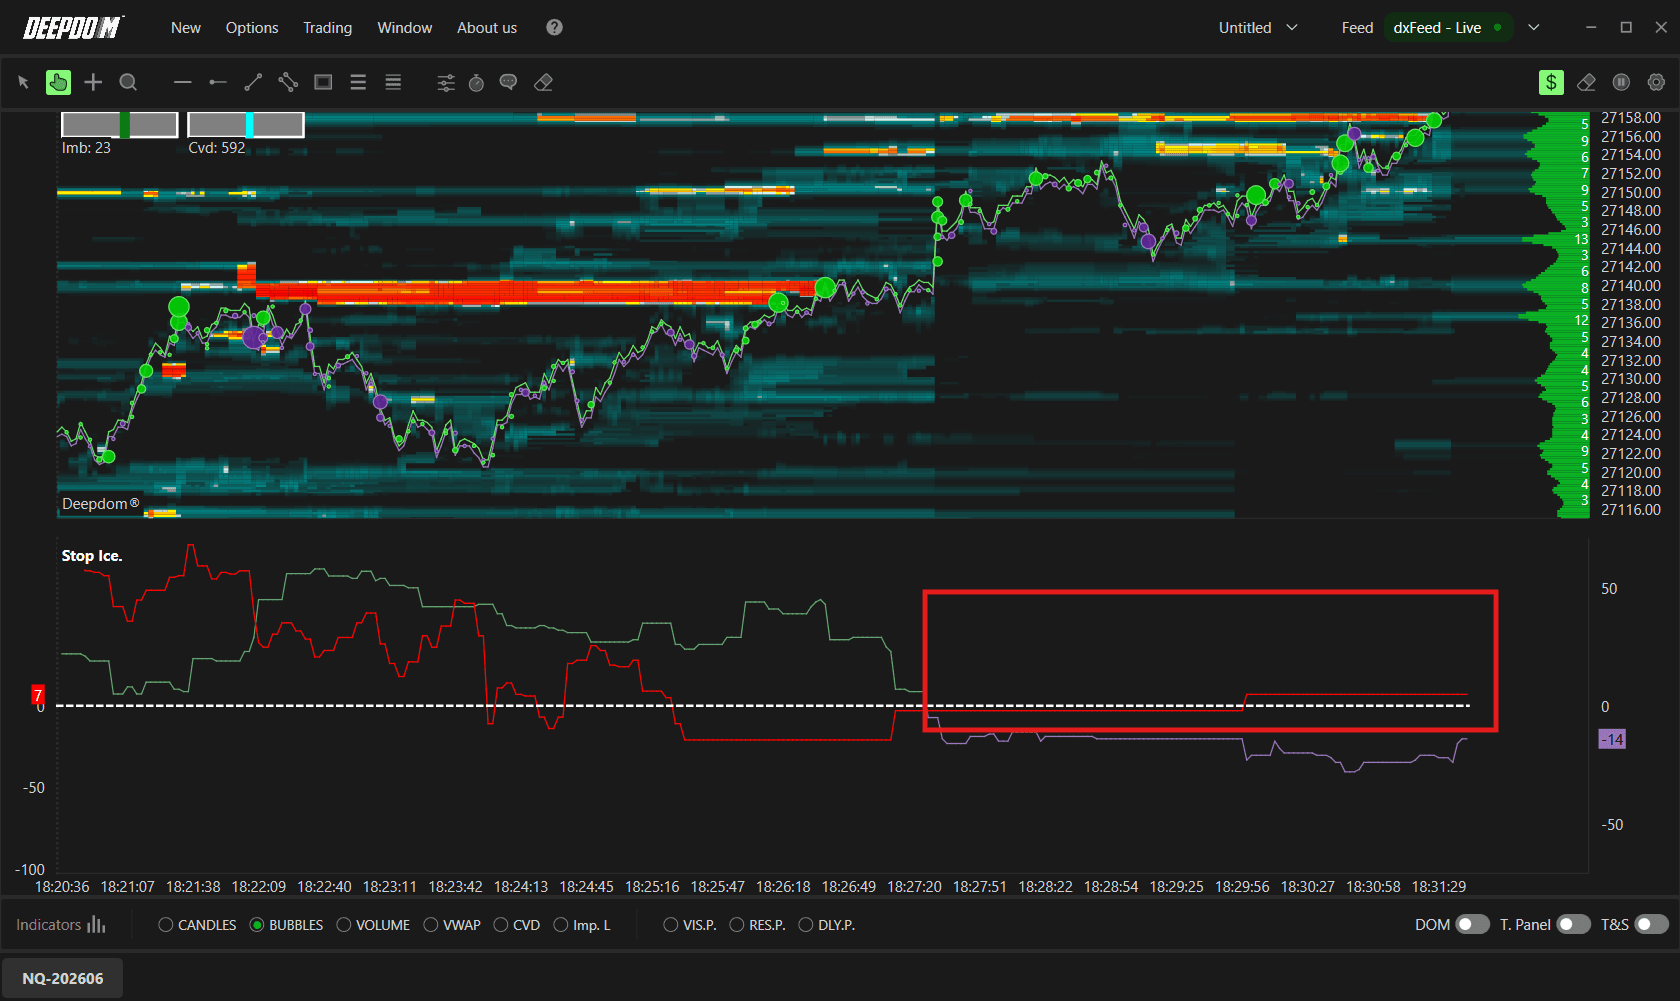
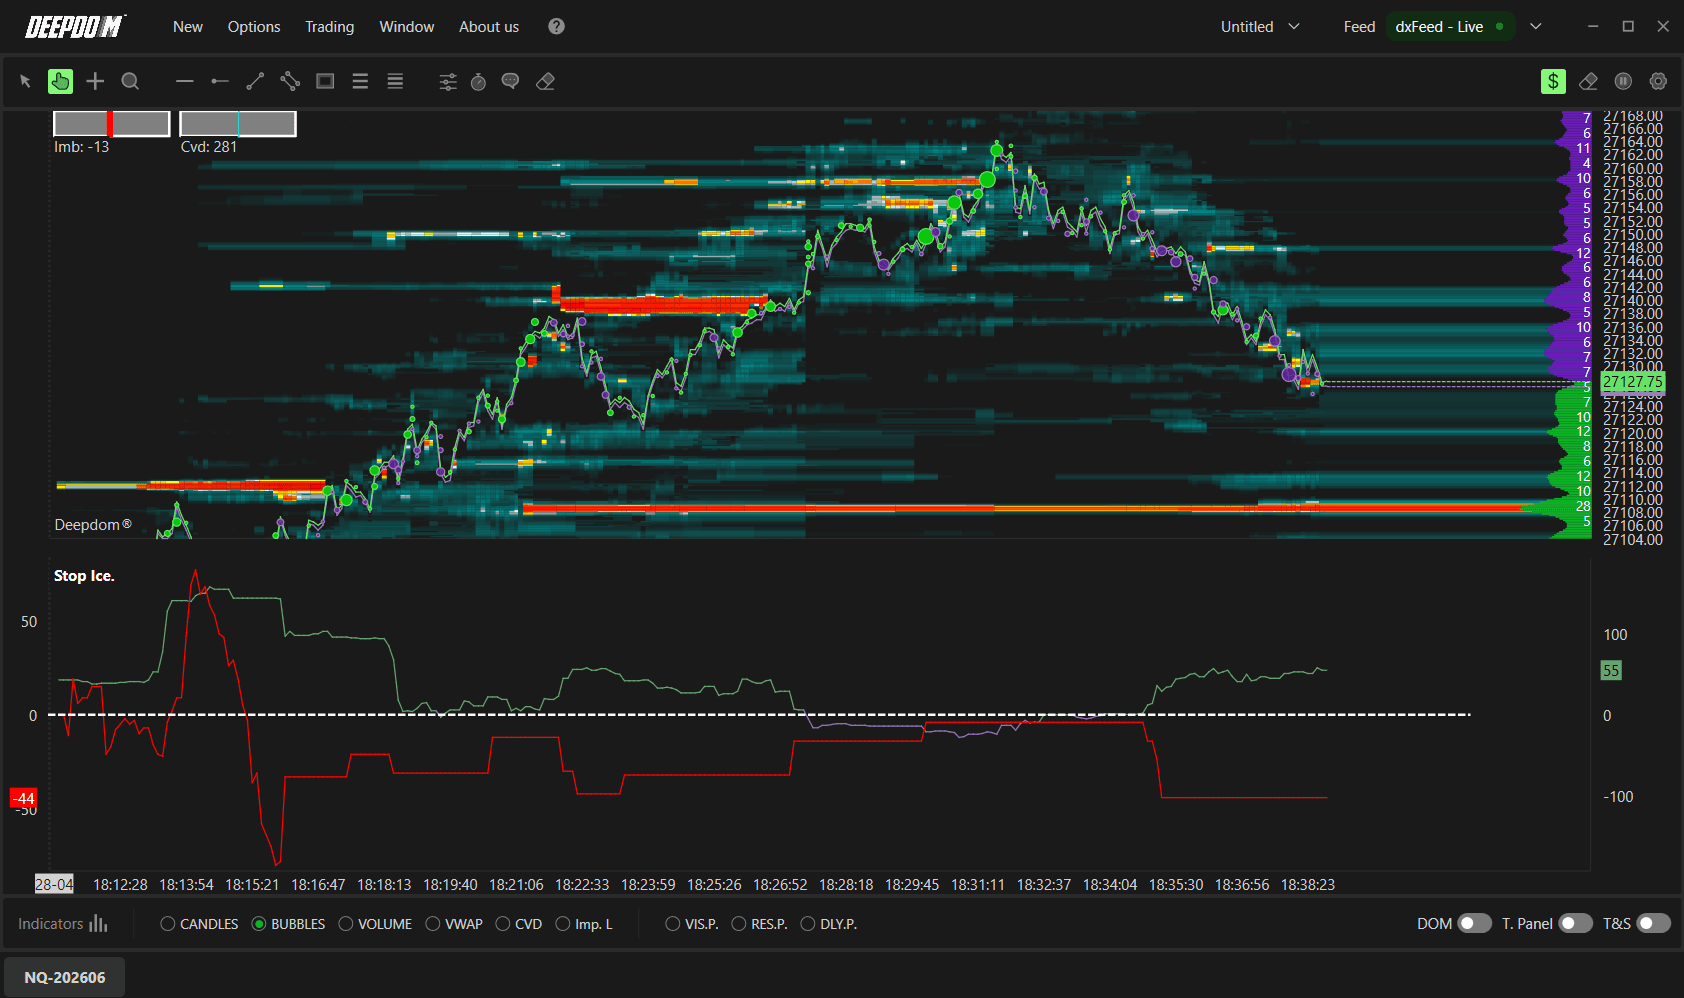
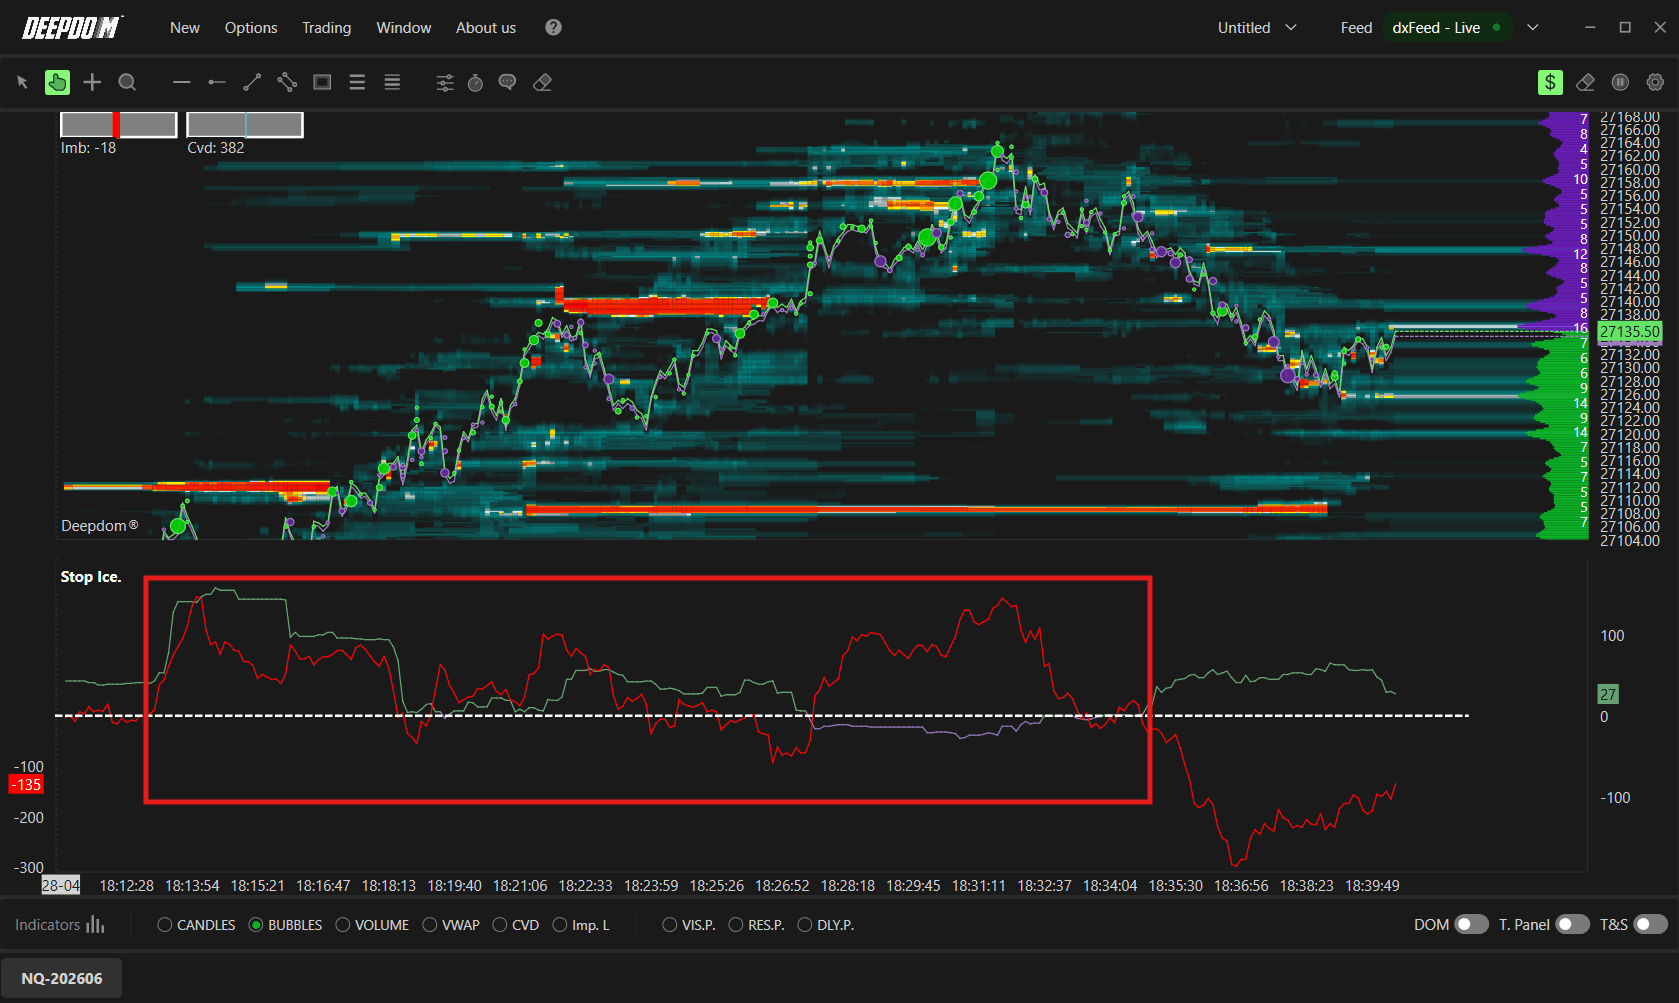
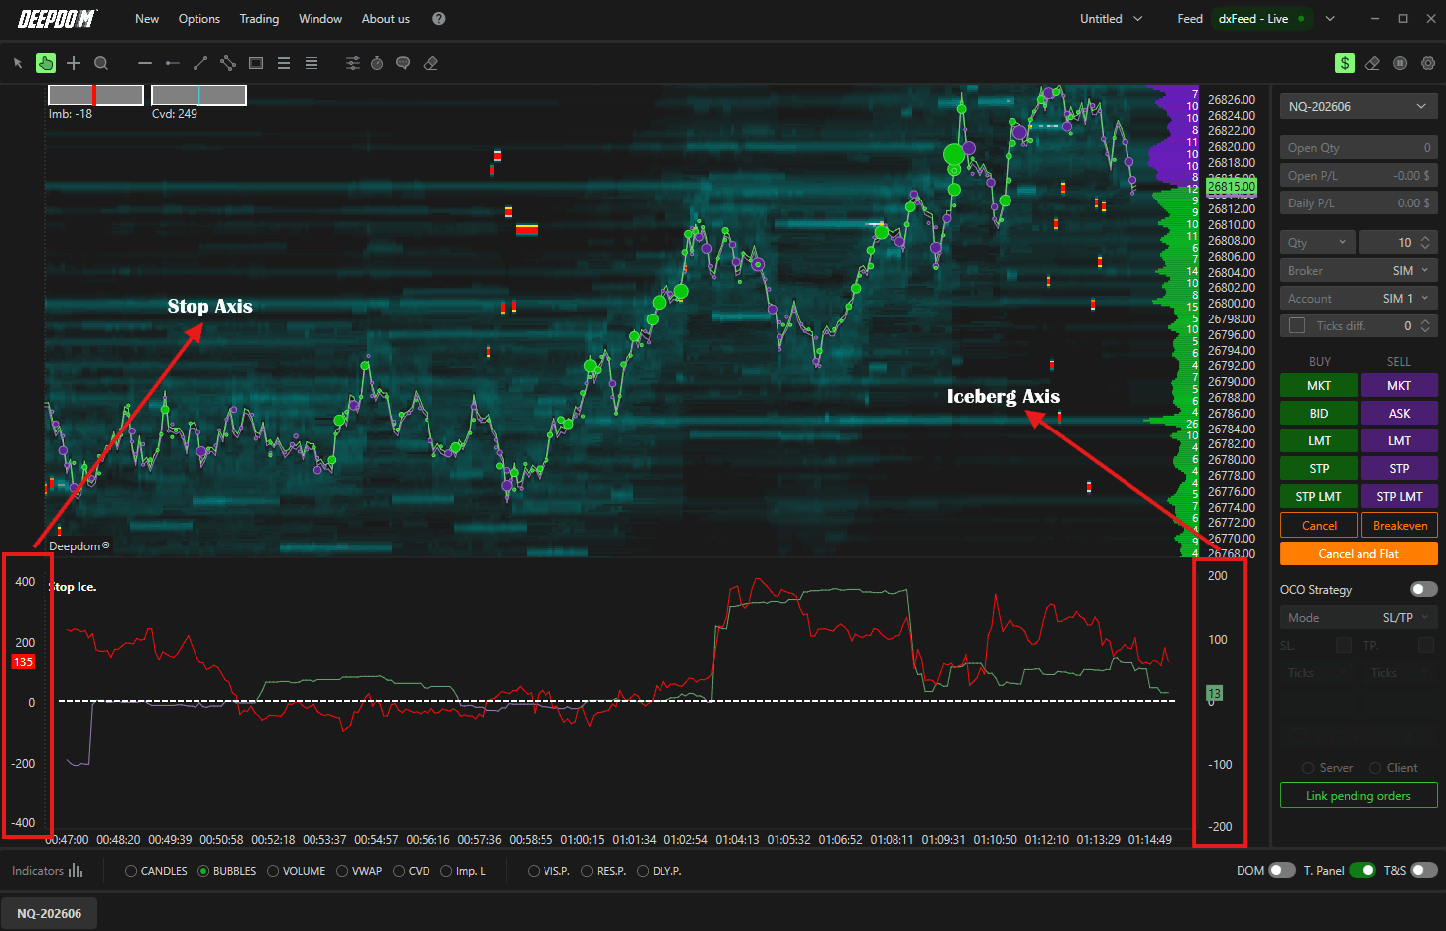
By default, the Stop Iceberg indicator displays both Iceberg and Stop data within the same chart area, using two axes:
Stop Axis — shows the quantity of Stop orders identified
Iceberg Axis — shows the quantity of Iceberg orders identified
You can also add multiple Stop Iceberg indicators to the same chart and configure them independently — for example, dedicating one indicator to Icebergs and another to Stops — allowing for a more customized and detailed view.
Display Mode Defines how order data is aggregated and displayed. Options include:
Sum — displays the cumulative total of orders during a market move. No time-based setting required
Last Minutes — displays orders executed within the last user-defined number of minutes
Last Seconds — displays orders executed within the last user-defined number of seconds
Display Parameters When using Last Minutes or Last Seconds mode, this sets the exact number of minutes or seconds used for the calculation.
Line Width Sets the thickness of the lines used to represent order activity on the chart.
Use Separate Axes When enabled, Iceberg and Stop data are displayed on separate axes for easier distinction between the two.
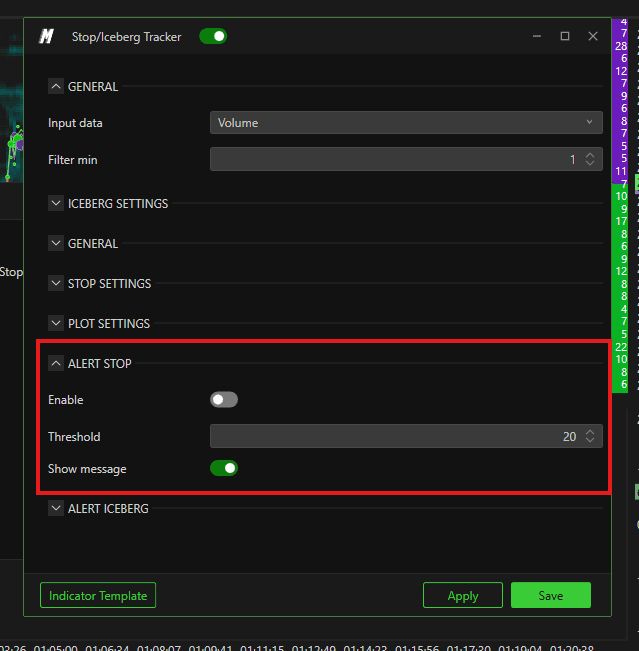
Alert Stop
Enable — turns on notifications for Stop order activity
Threshold — sets the minimum number of Stop orders the indicator must identify before a notification is triggered
Enable Popup — when enabled, a popup alert appears on screen when the threshold is reached
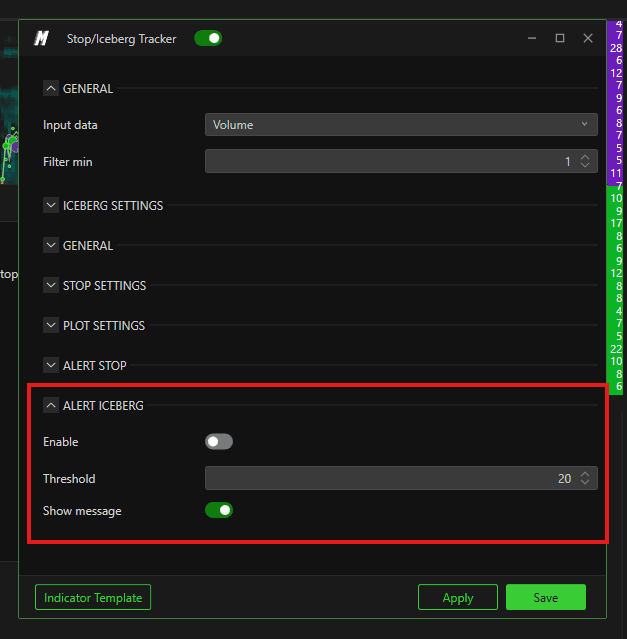
Alert Iceberg
Enable — turns on notifications for Iceberg order activity
Threshold — sets the minimum number of Iceberg orders the indicator must identify before a notification is triggered
Enable Popup — when enabled, a popup alert appears on screen when the threshold is exceeded
Conclusion
The Stop Iceberg indicator gives you a unique window into two of the most impactful hidden order types in the market. By understanding where Iceberg orders are absorbing pressure and where Stop orders are clustering, you can gain a significant edge in anticipating potential price reactions and understanding the behavior of institutional players at key levels.
Still Having Trouble?
Our support team is available 24/7 and ready to help you with any issue you encounter.
When reaching out, please include:
A screenshot of the issue
A brief description of what you were trying to do
Support Ticket (Fastest Response) Visit www.deepcharts.com and create a support ticket directly on our website.
Email Support Reach us at support@deepcharts.com — please note that email responses may take a little longer than a support ticket.