Indicators
Updated:
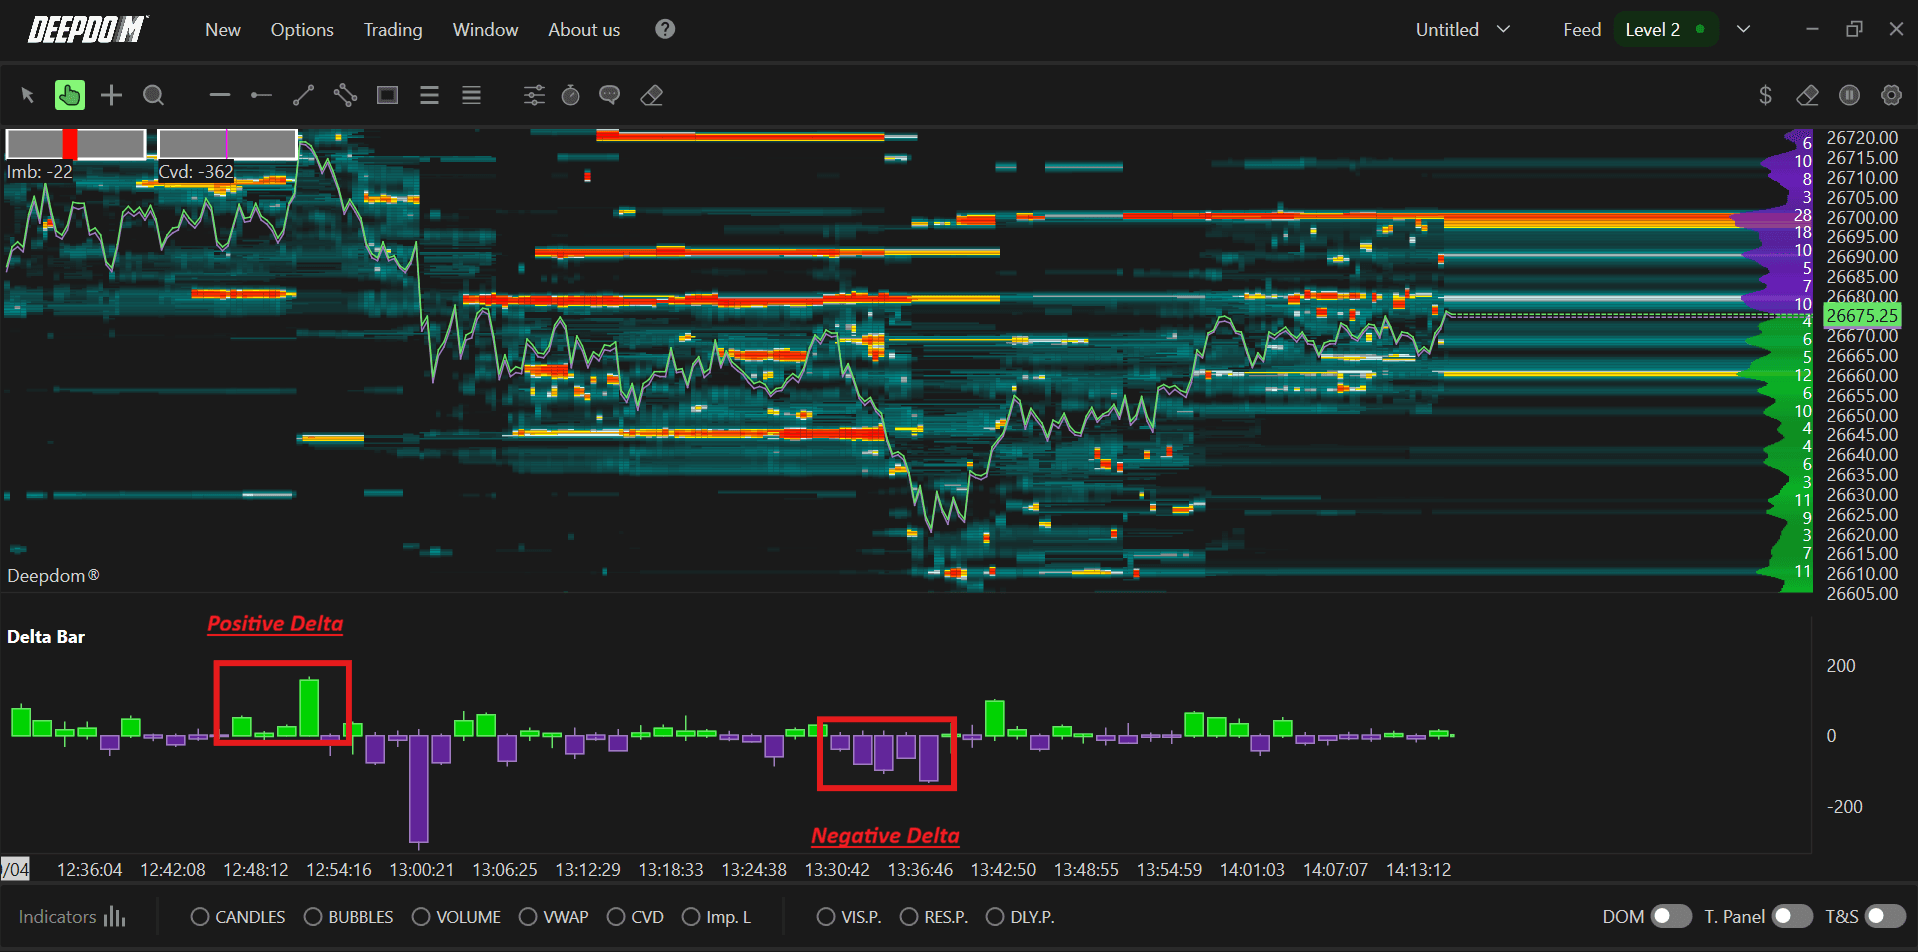
The Delta Bar indicator in DeepDom displays the delta (difference between buy‑market and sell‑market volume) as bars plotted beneath the chart, helping you see where aggressive buyers or sellers dominated each period.
Settings of Use
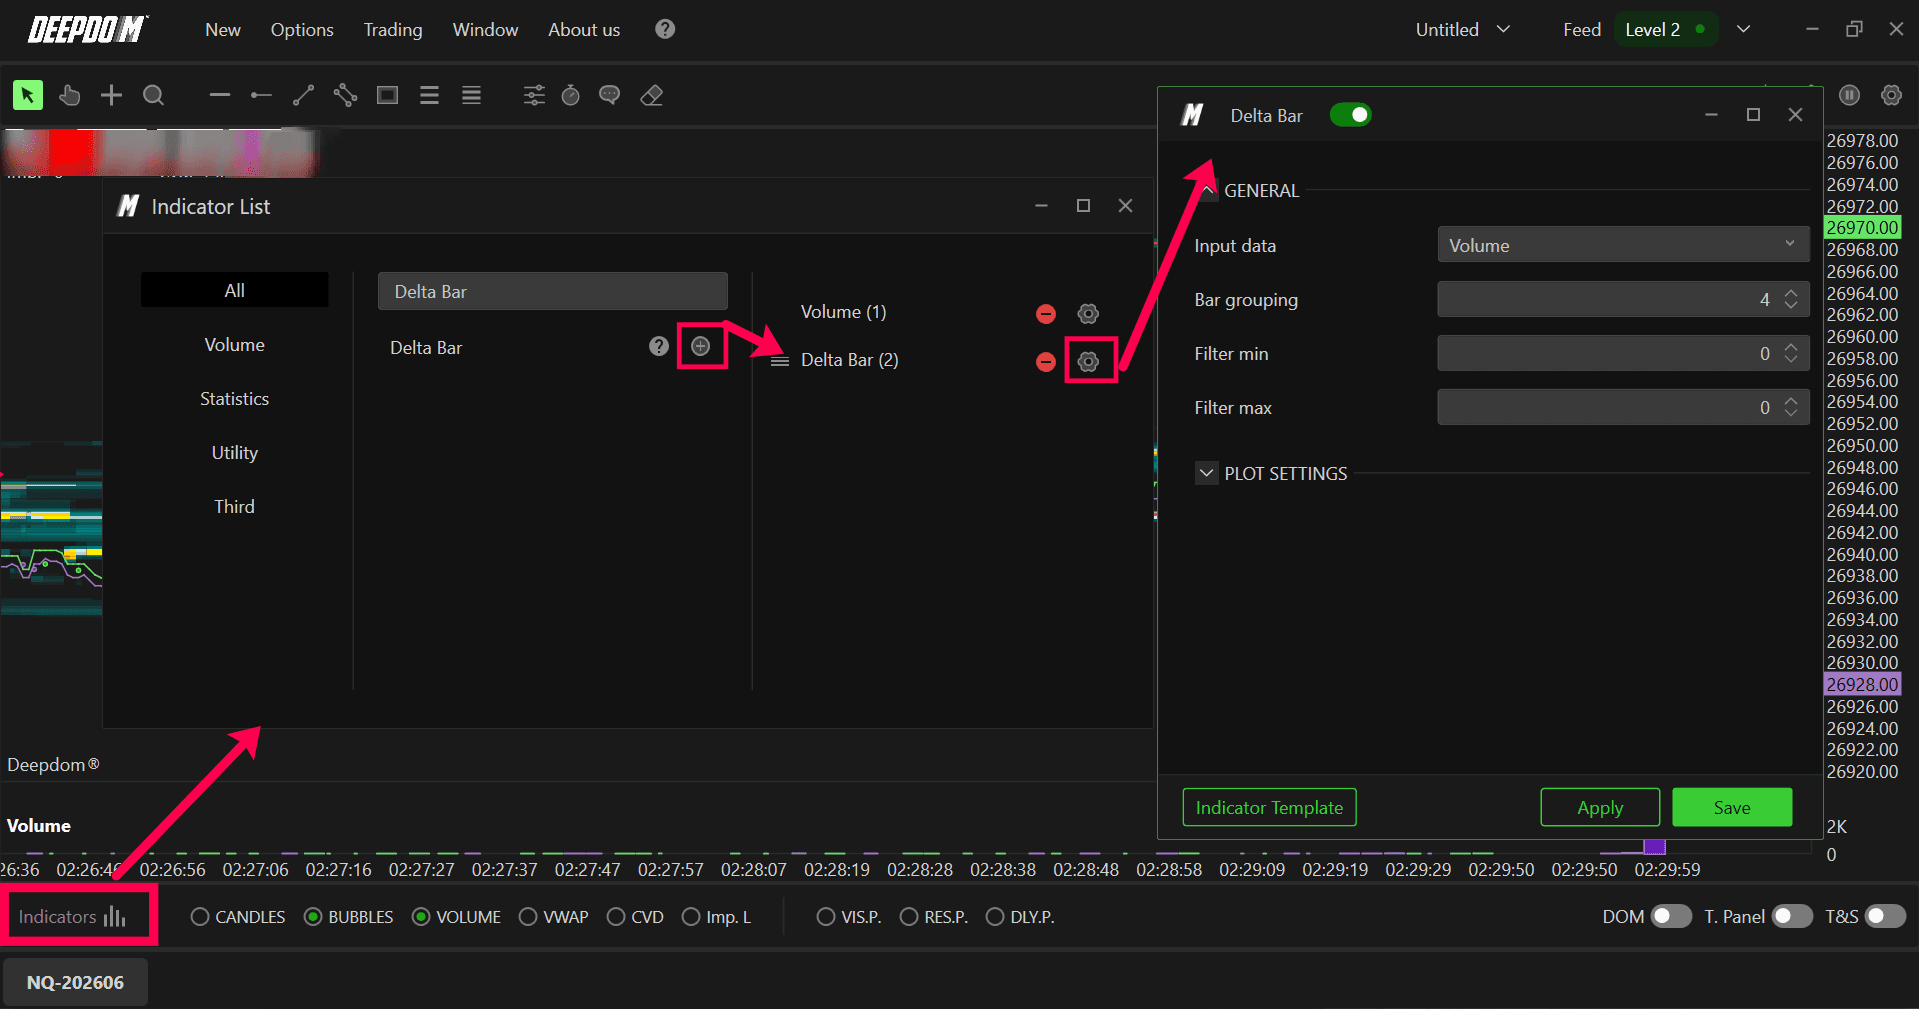
Open the indicator configuration by clicking the settings icon next to Delta Bar in the Indicators list. The window allows you to control the calculation database, bar grouping, and volume filters.
General Settings
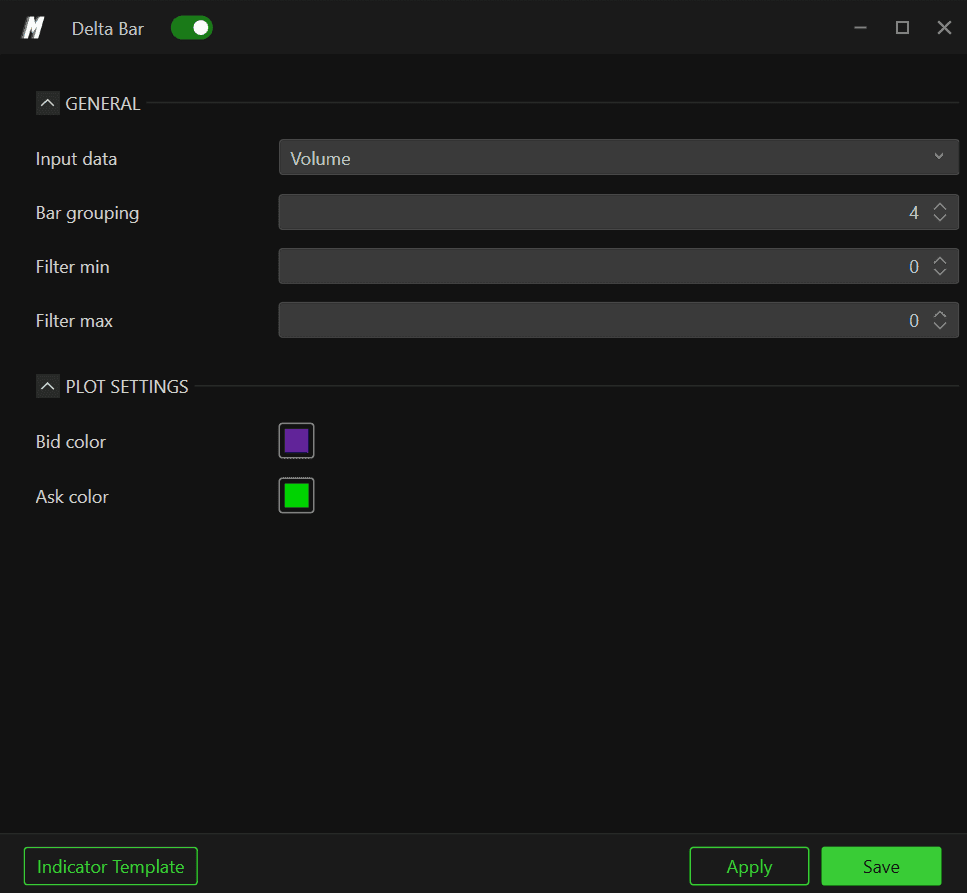
Input data
Choose which Input to use for the delta calculation:
Volume – total traded volume at each price level; useful for gauging trade intensity and key price zones.
Aggregate Trades – groups trades executed at the same price within a short time window to show aggregated volume linked to larger orders.
Trades – counts the number of transactions at each price level.
Order – uses order data (buy and sell quantities) to evaluate order‑flow pressure.
Bar grouping
Defines how many bars are grouped together in each Delta Bar. A lower value provides more granular data, while a higher value smooths the series.
Filters
Filter min – applies a minimum threshold to the chosen database, hiding bars below that value.
Filter max – applies a maximum threshold. Leaving this set to 0 disables the maximum filter.
Plot Settings
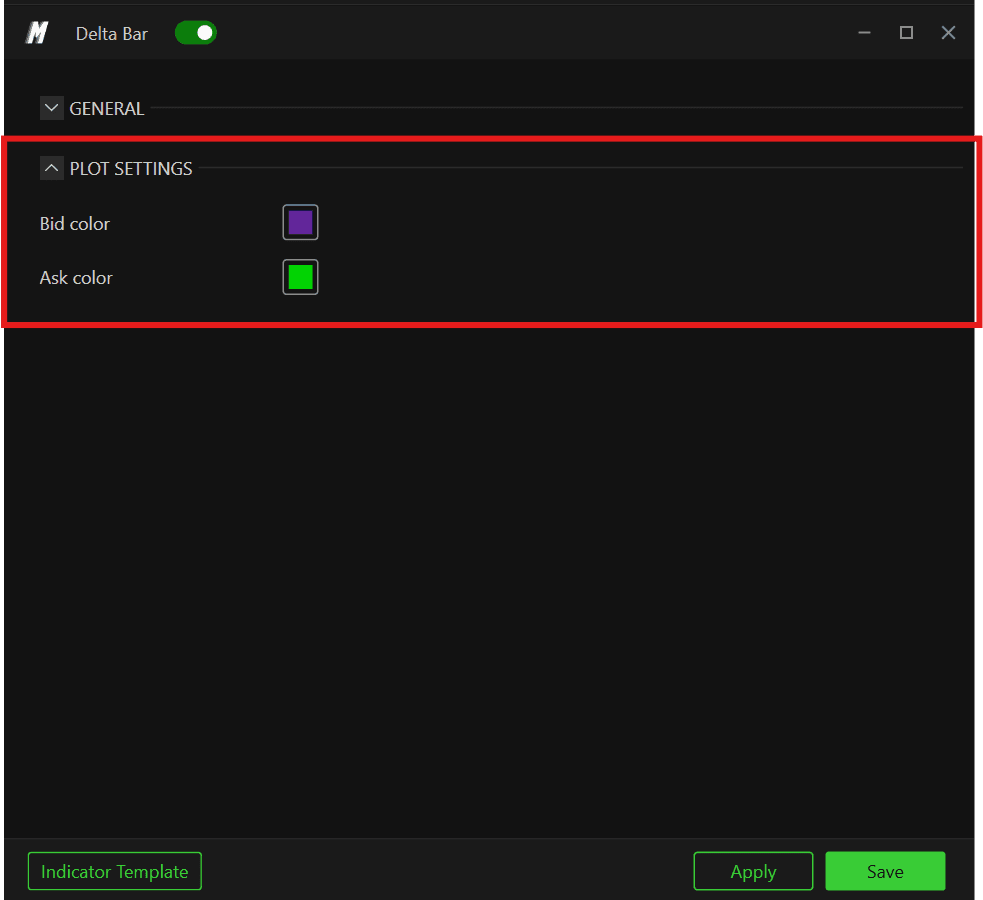
Bid Color - Selects the Bid color
Ask Color - Selects the Ask color
Reading Patterns with Delta Bar
1. Trend Confirmation
In a healthy up‑trend you typically see sequences of positive Delta Bars aligned with price making higher highs. Pullbacks within the trend often show smaller or even slightly negative delta, but these should be shallow compared to the dominant positive bars.
If price continues to push higher while positive delta becomes weaker or turns negative, it can signal hidden selling or reduced participation, warning of a possible reversal.
2. Absorption at Levels
When price tests a prior high and Delta Bars show strong positive spikes but price fails to break and instead rotates lower, this often means limit sellers are absorbing aggressive buyers at that level. Similar logic applies for lows with strong negative delta that fail to extend.
3. Exhaustion and Climaxes
Very large one‑off Delta Bars after an extended move frequently mark capitulation – all late traders jump in just as professionals take the other side. Watching what happens in the next few bars helps you decide whether to fade such extremes or wait for confirmation.
Best Practices and Common Mistakes
Do not trade delta in isolation: always anchor it to structure (support/resistance, Day high/low, VWAP).
Avoid over‑filtering: very high Filter min values can hide early signs of initiative that later develop into major moves.
Watch product specifics: Micro contracts and thin products require smaller thresholds than highly liquid index futures.