Indicators
Updated:
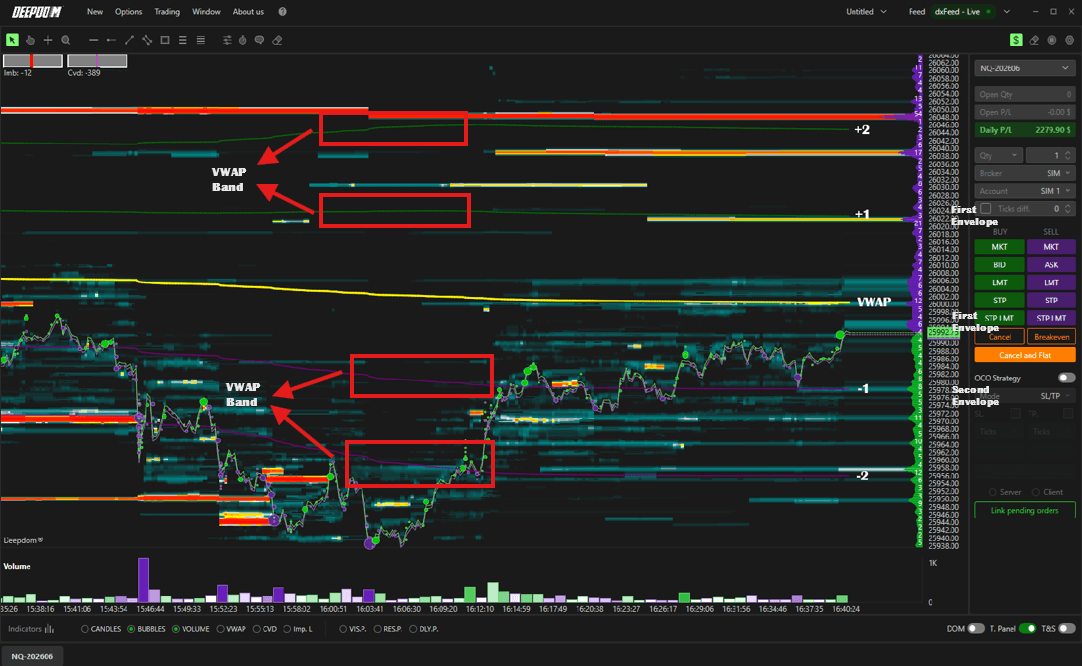
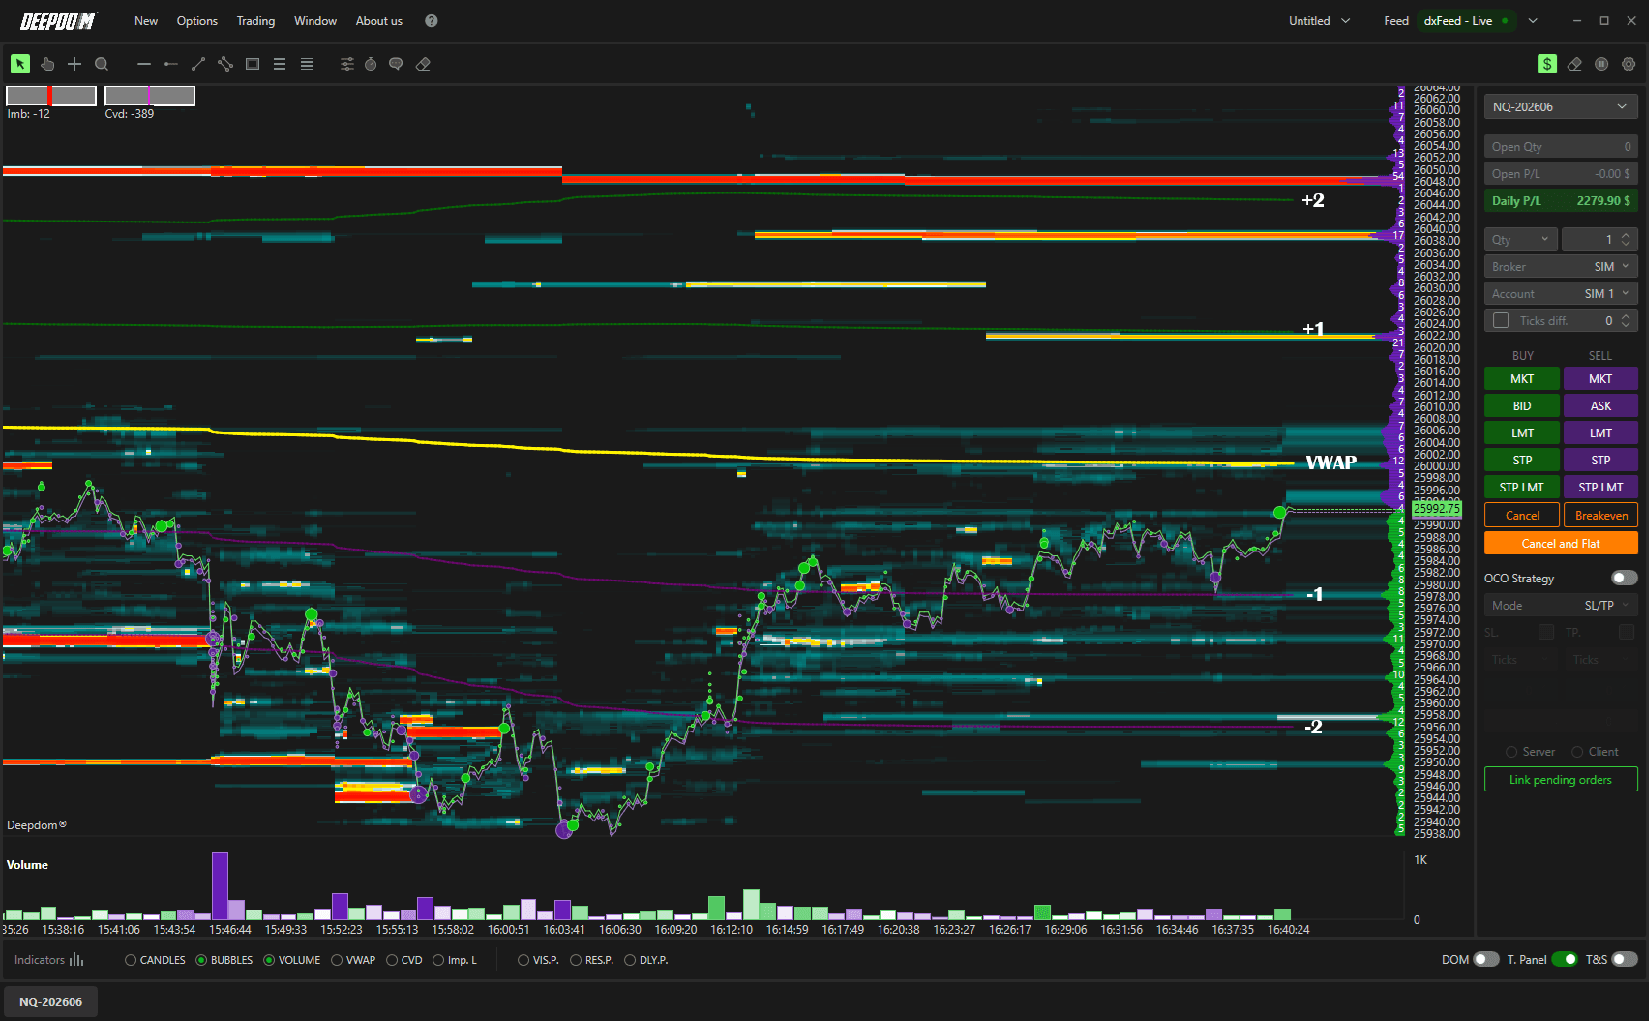
The VWAP (Volume Weighted Average Price) indicator displays the average price of trades weighted by volume over a chosen time period, along with standard deviation bands above and below it.

What is the VWAP? Think of the VWAP as the "true average price" of the market — but smarter than a regular average. Instead of treating every trade equally, it gives more weight to price levels where more volume was traded. This makes it a much more accurate representation of where the market has been doing most of its business. Traders use it as a benchmark for fair value — if price is above the VWAP, it is trading at a premium; if it is below, it is trading at a discount.
Standard deviation bands measure how far price is moving away from the average. They help traders identify Premium and Discount zones — areas where price is trading above or below fair value — and can be used to make more informed entry and exit decisions.
Here is what each band represents:
First Standard Deviation (+1 / -1) — the main volatility range; where price spends most of its time. This is considered the "normal" zone around fair value
Second Standard Deviation (+2 / -2) — signals greater volatility and potential significant price moves. Price reaching here is less common and may indicate an overextended move
Third Standard Deviation (+3 / -3) — represents rare, extreme price movements. Price at this level is statistically unusual and may signal a strong potential for a pullback toward the VWAP
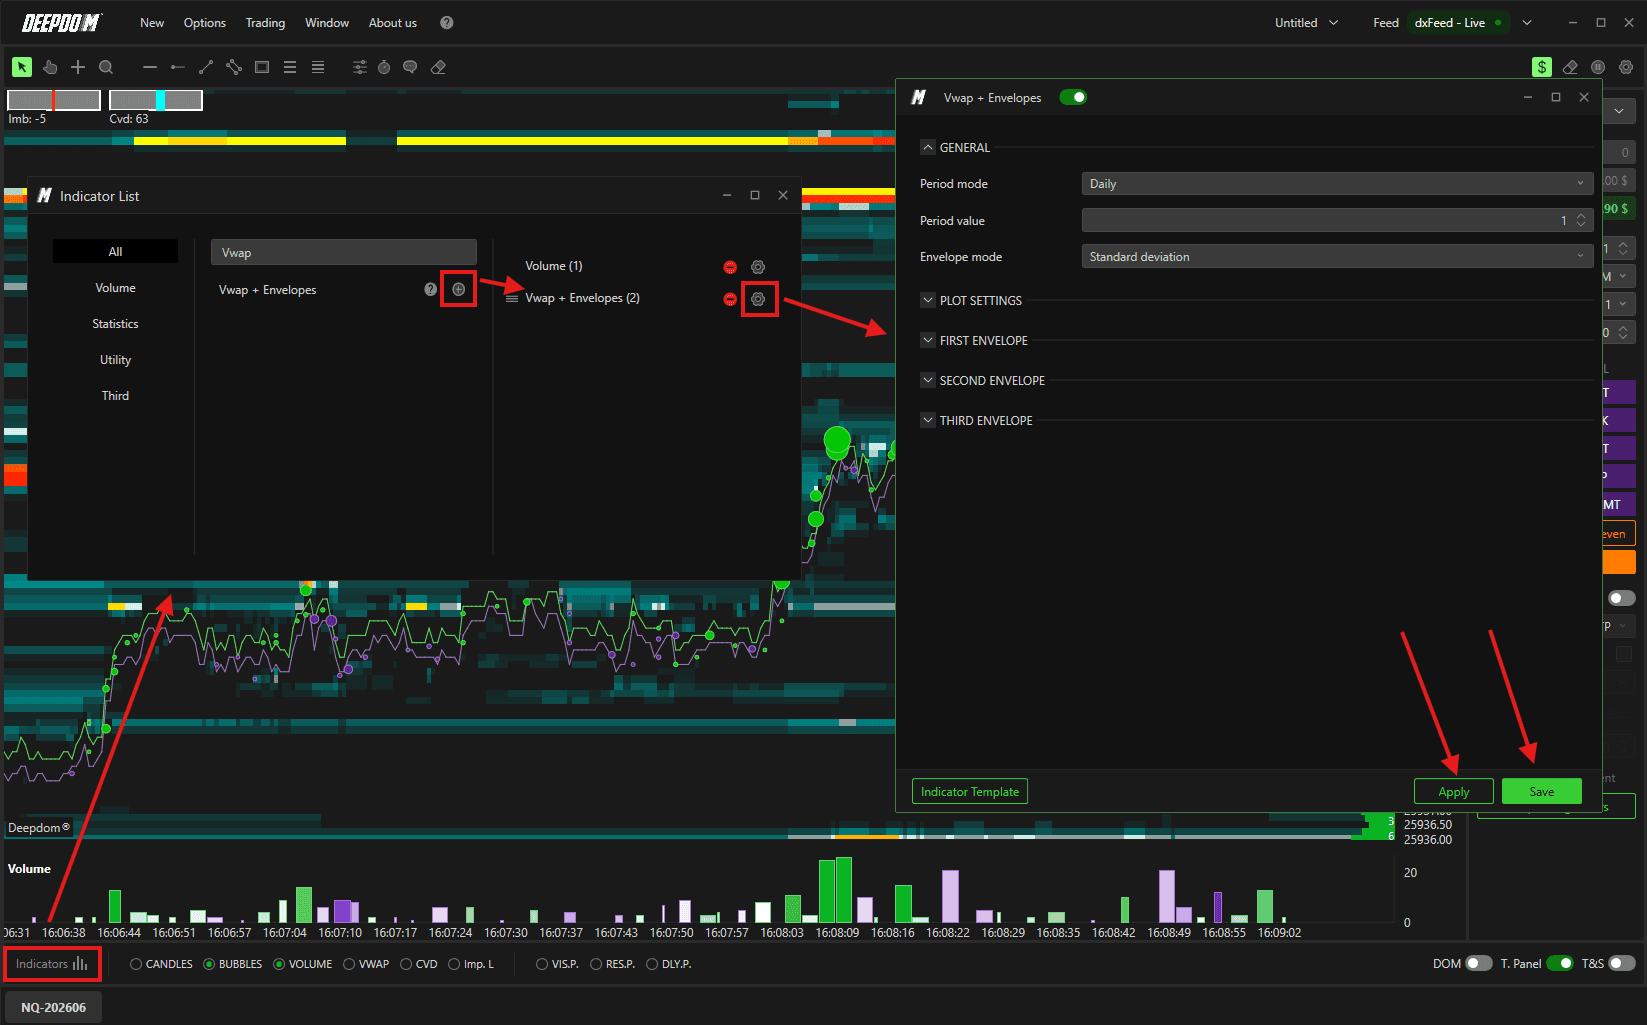
How to Add the VWAP to Your Chart
There are two ways to add the VWAP indicator:
Click Indicators in the lower left corner, find VWAP in the list, and click + to add it
Or enable it directly from the Toolbar at the bottom of the chart
Once added, click the settings icon on the indicator to open its configuration window.
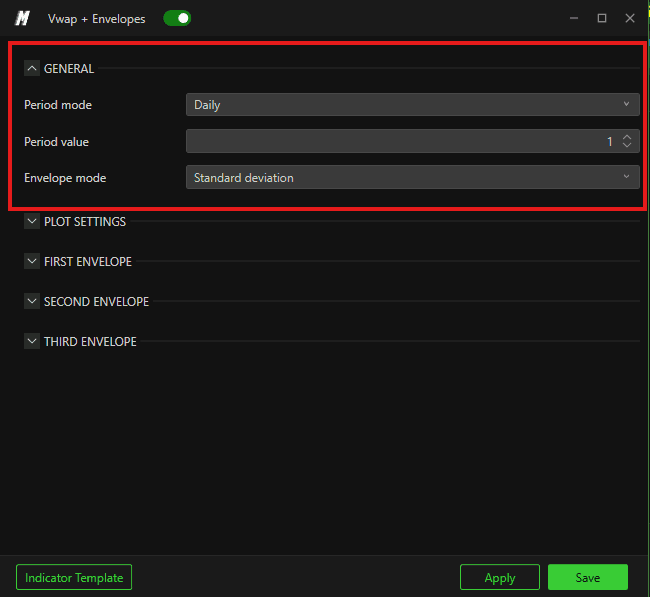
General Settings
Period Mode Defines the time period used to calculate the VWAP. You can choose between:
Day — calculates the VWAP from the start of the current trading day, resetting at the open of each new session
Minutes — calculates the VWAP over a set number of minutes, giving you a shorter-term view of fair value
Seconds — calculates the VWAP over a set number of seconds, useful for very short-term analysis
Orders — calculates the VWAP based on a set number of orders rather than a time period
Period Value Sets the numeric value for the period chosen above. For example, if you selected Minutes, you would enter 30 here for a 30-minute VWAP.
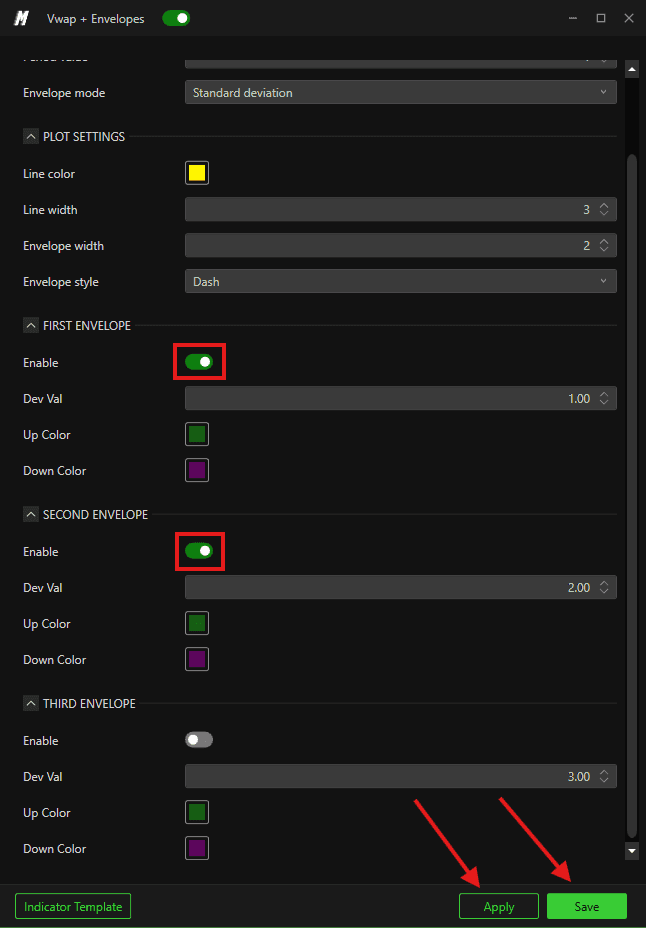
Envelope Mode Defines how the bands are calculated. You can choose between:
Standard Deviation — bands are based on statistical deviation from the VWAP, automatically adjusting to market volatility
Percentage — bands are based on a fixed percentage change from the VWAP price, staying consistent regardless of volatility
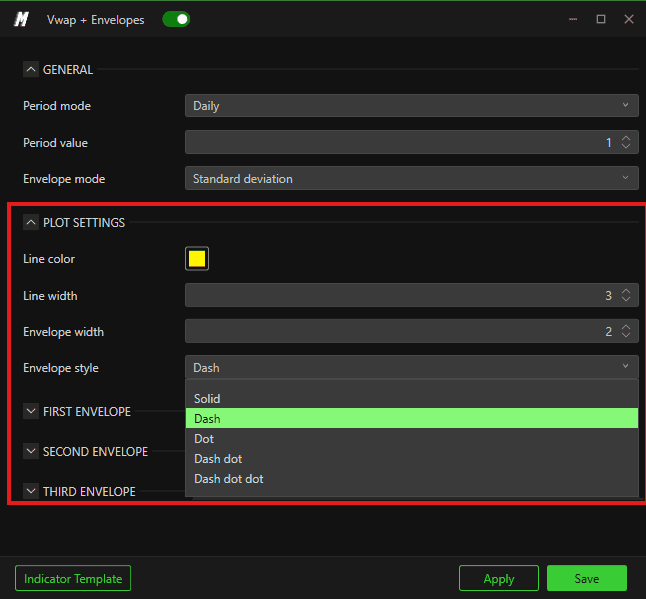
Display Settings
Line Color Sets the color of the VWAP line on the chart.
Line Width Sets how thick the VWAP line appears.
Envelope Width Sets the thickness of the standard deviation bands.
Envelope Style Sets the line style of the bands — for example solid, dashed, or dotted.
Band Settings — First, Second & Third Band
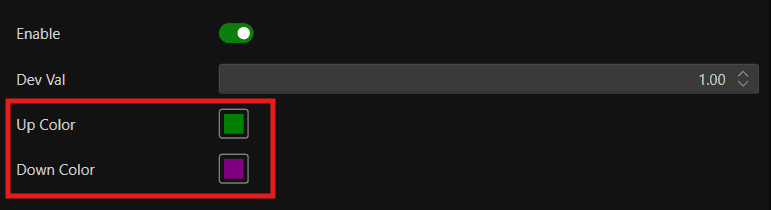
Each of the three bands can be individually configured:
Enable or disable each band independently
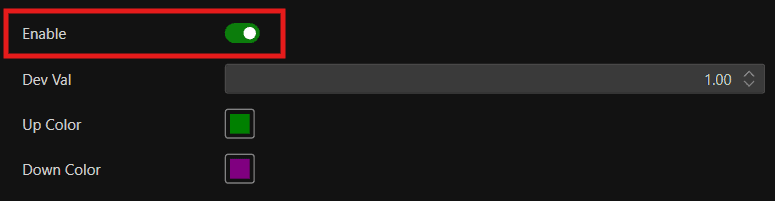
Set the standard deviation value for each band
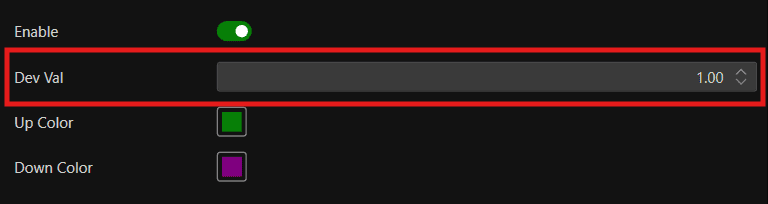
Choose a custom color for each band
This allows you to show only the bands that are relevant to your trading style — for example, enabling just the first and second bands while leaving the third off. Keeping fewer bands active can make the chart easier to read, especially in fast-moving markets.
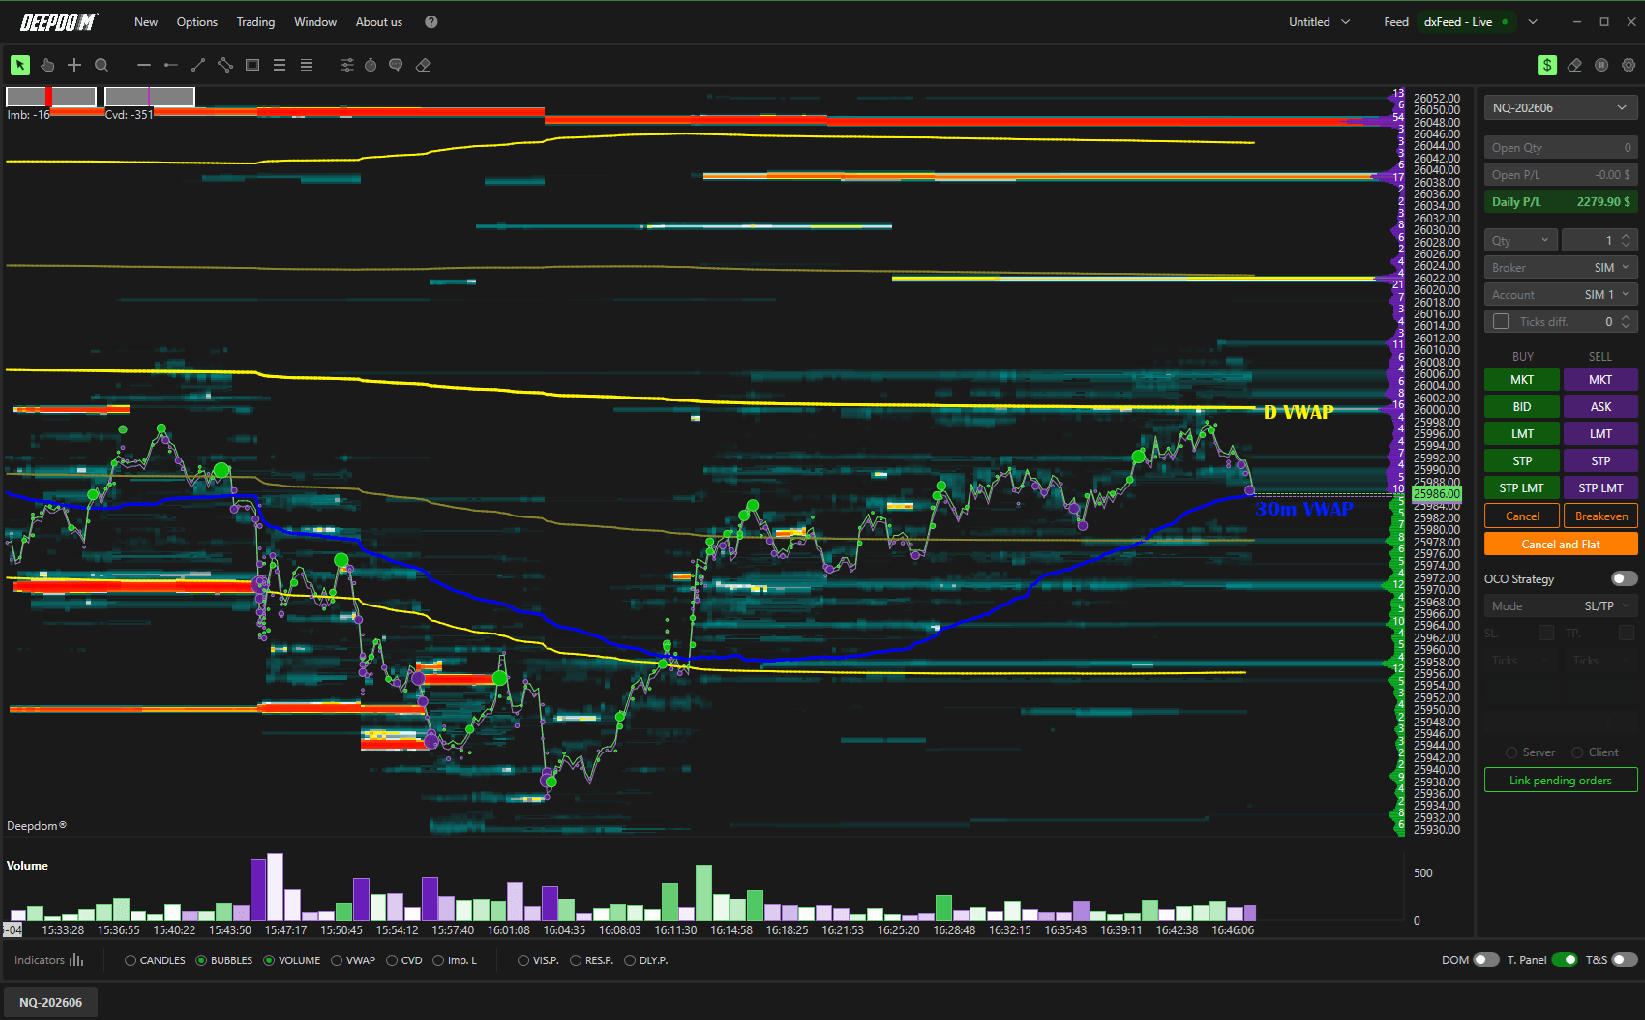
Using Multiple VWAPs
You can apply more than one VWAP indicator to the same chart at the same time. A common example is combining a Daily VWAP with a shorter-period VWAP to get both a macro and a micro view of fair value.
For example — a daily VWAP in yellow and a 30-minute VWAP in blue applied to the same chart. The daily VWAP shows you the bigger picture of where fair value is for the whole session, while the 30-minute VWAP shows you where fair value is right now within that session.
Conclusion
The VWAP indicator is one of the most widely used tools in order flow trading. By combining the VWAP line with its standard deviation bands, you can quickly identify whether price is trading at fair value, in a premium, or in a discount — giving you a structured framework for your entries and exits.
Still Having Trouble?
Our support team is available 24/7 and ready to help you with any issue you encounter.
When reaching out, please include:
A screenshot of the issue
A brief description of what you were trying to do
Support Ticket (Fastest Response) Visit www.deepcharts.com and create a support ticket directly on our website.
Email Support Reach us at support@deepcharts.com — please note that email responses may take a little longer than a support ticket.