Indicators
Updated:
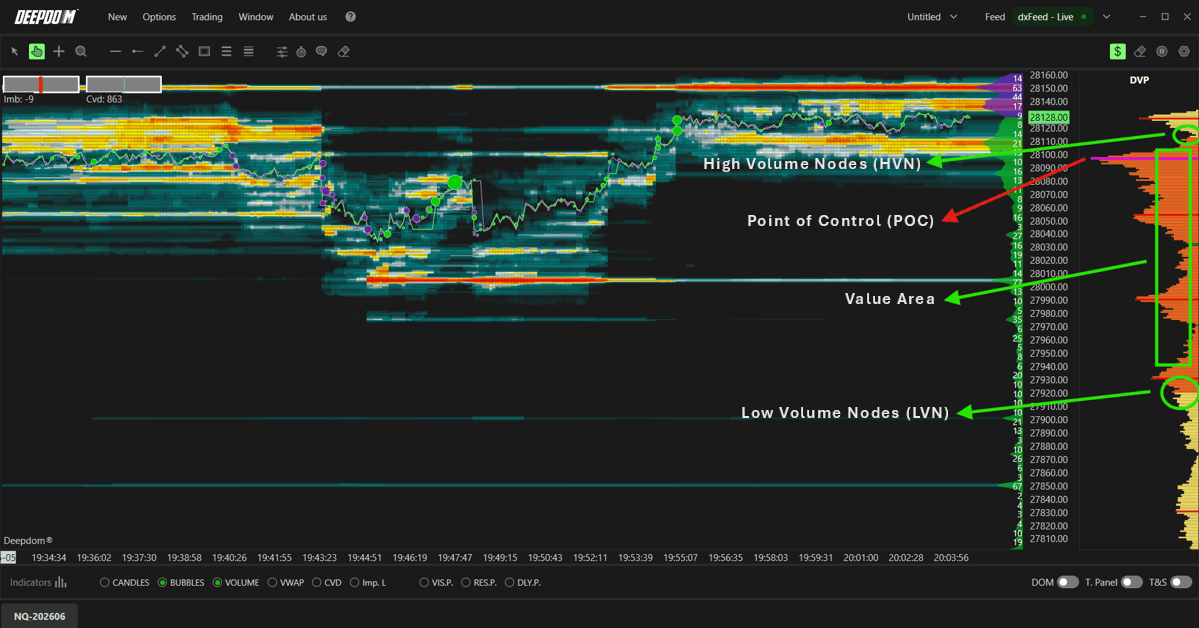
The Deep Profile, displays the volume traded at each price level over a specific period. It gives you a clear visual map of where most market activity has taken place, helping you identify key structural levels including:
POC (Point of Control) — the price level with the highest traded volume
Value Area — the price range where a defined percentage of total volume occurred
High Volume Nodes (HVN) — price levels with heavy activity, often acting as support or resistance
Low Volume Nodes (LVN) — price levels with little activity, often allowing fast price movement through them
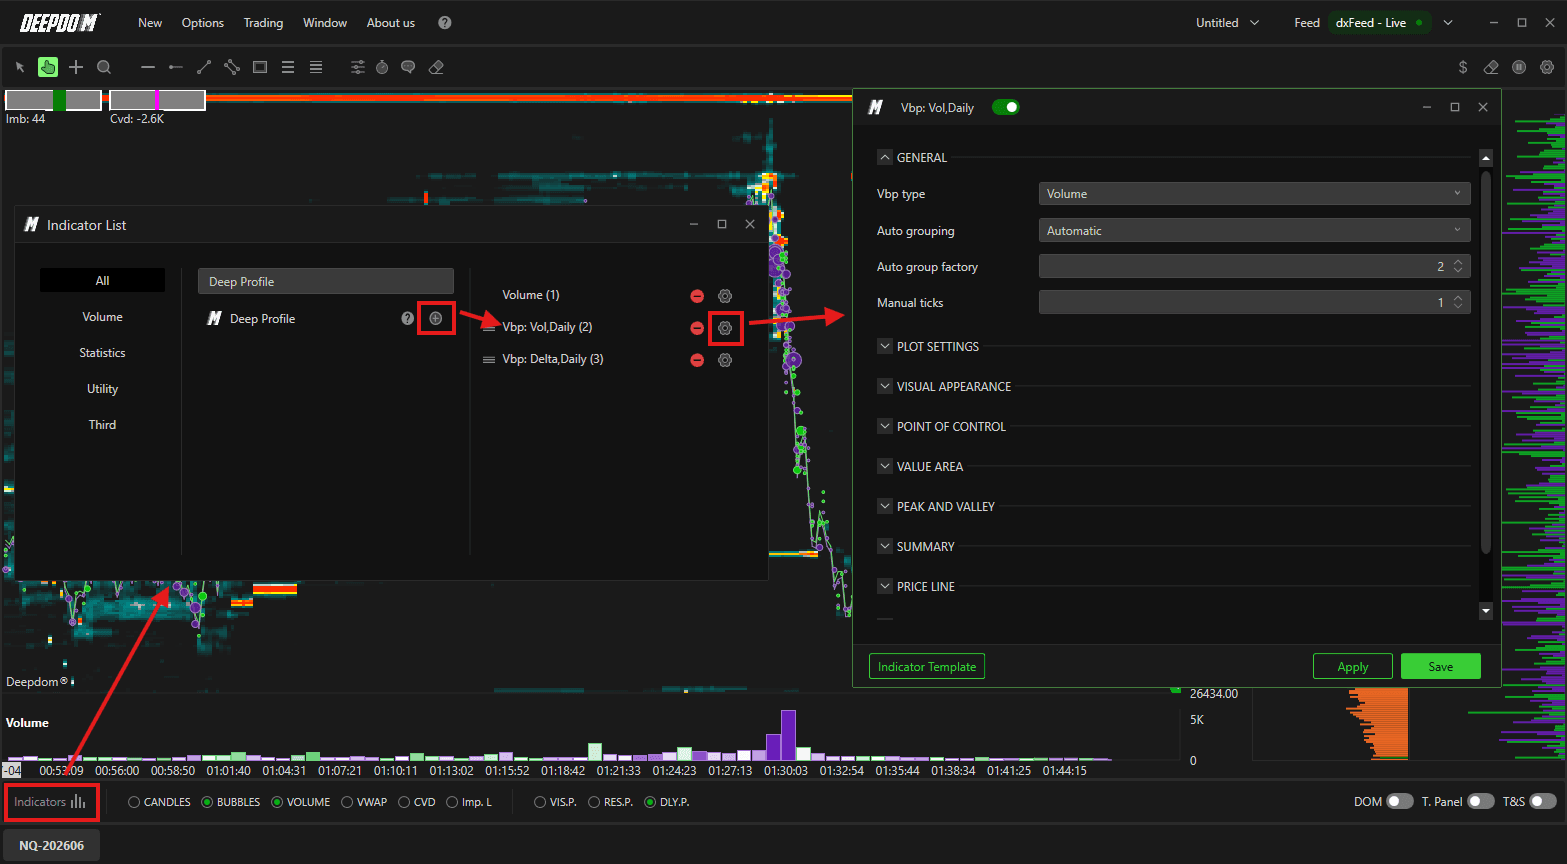
How to Add the Volume Profile to Your Chart
Click the Indicators icon on the chart and select Deep Profile from the list
Or enable it directly from the Toolbar at the bottom of the chart
Click the settings icon on the indicator to open its configuration window
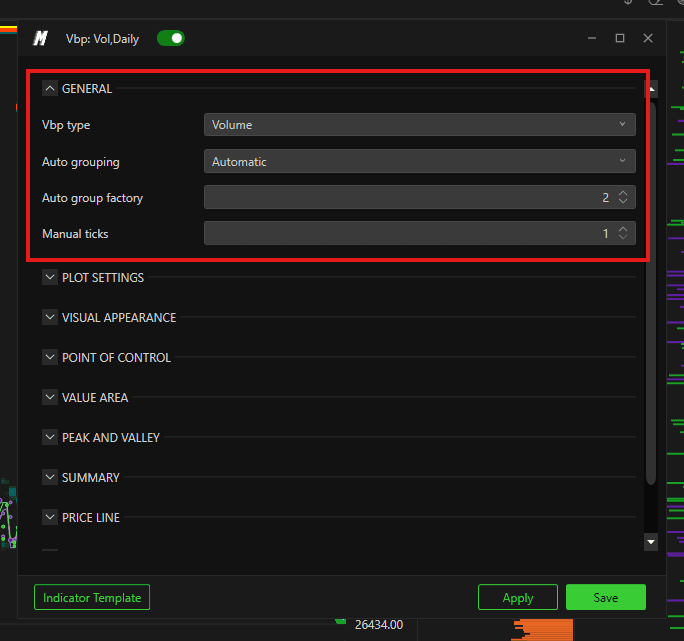
General Settings
Vbp Type Select what data the profile displays:
Volume — shows total volume traded at each price level, highlighting the most active areas
Ask/Bid Volume — splits the volume into Ask (sell) and Bid (buy) separately, showing the balance between buyers and sellers
Delta — shows the difference between buy and sell volume at each level, useful for identifying market pressure
Total Delta and Volume — combines both delta and total volume for a complete view of activity at each price level
Grouping Defines how price levels are grouped together in the profile:
Automatic — DeepDom automatically groups ticks based on market characteristics and chart resolution
Manual — lets you specify a custom number of ticks for grouping
Auto Group Factor When using Automatic grouping, this defines how aggressively ticks are aggregated. A higher value means greater aggregation and a broader profile.
Manual Ticks When using Manual grouping, this sets the exact number of ticks to group together, giving you precise control over the granularity of the profile.
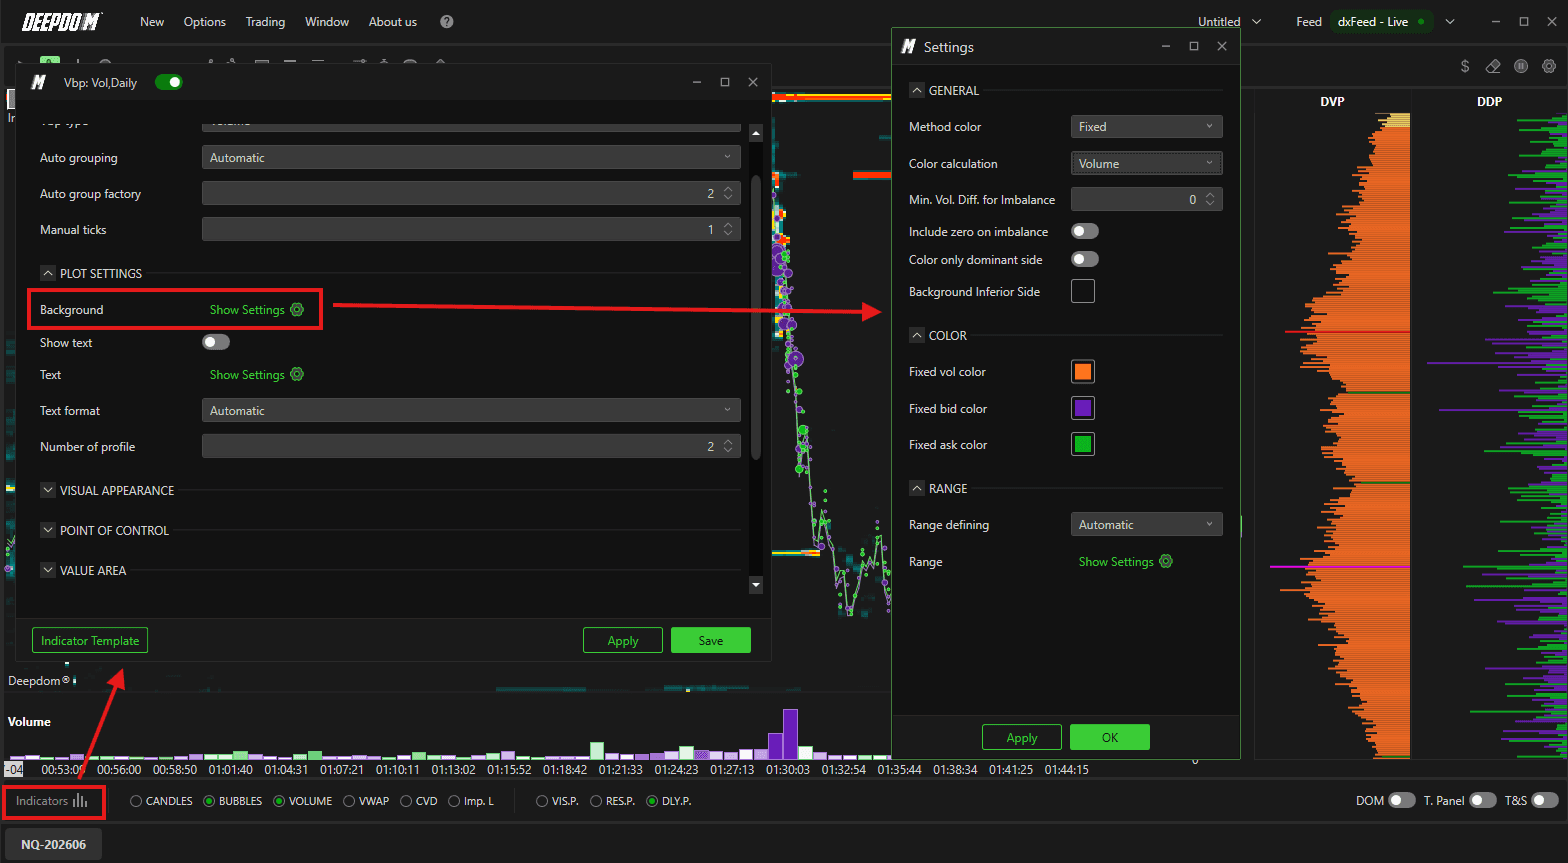
Plot Settings
Method Color — Defines how the profile bars are colored:
None — no color applied, plain data display
Fixed — a single uniform color applied to all price levels
Fading — color intensity varies with volume; higher volume levels appear more intense, lower volume levels appear lighter
More Colors — uses a range of colors to represent different volume levels, fully customizable by the user
Color Calculation — Defines what the color represents:
Volume — colors based on total volume
Delta — colors based on the difference between buy and sell orders
Imbalance — colors based on order imbalance
Color Lets you set fixed colors for Volume, Bid, Ask, and the profile line.
Range Defines the range used for color scaling:
Automatic — uses platform default ranges
User — lets you define custom value ranges
Show Text When enabled, displays the total volume traded at each tick or price level directly on the profile bars.
Text Settings Lets you customize the color of the Bid, Ask, and Total Volume labels, as well as the font size.
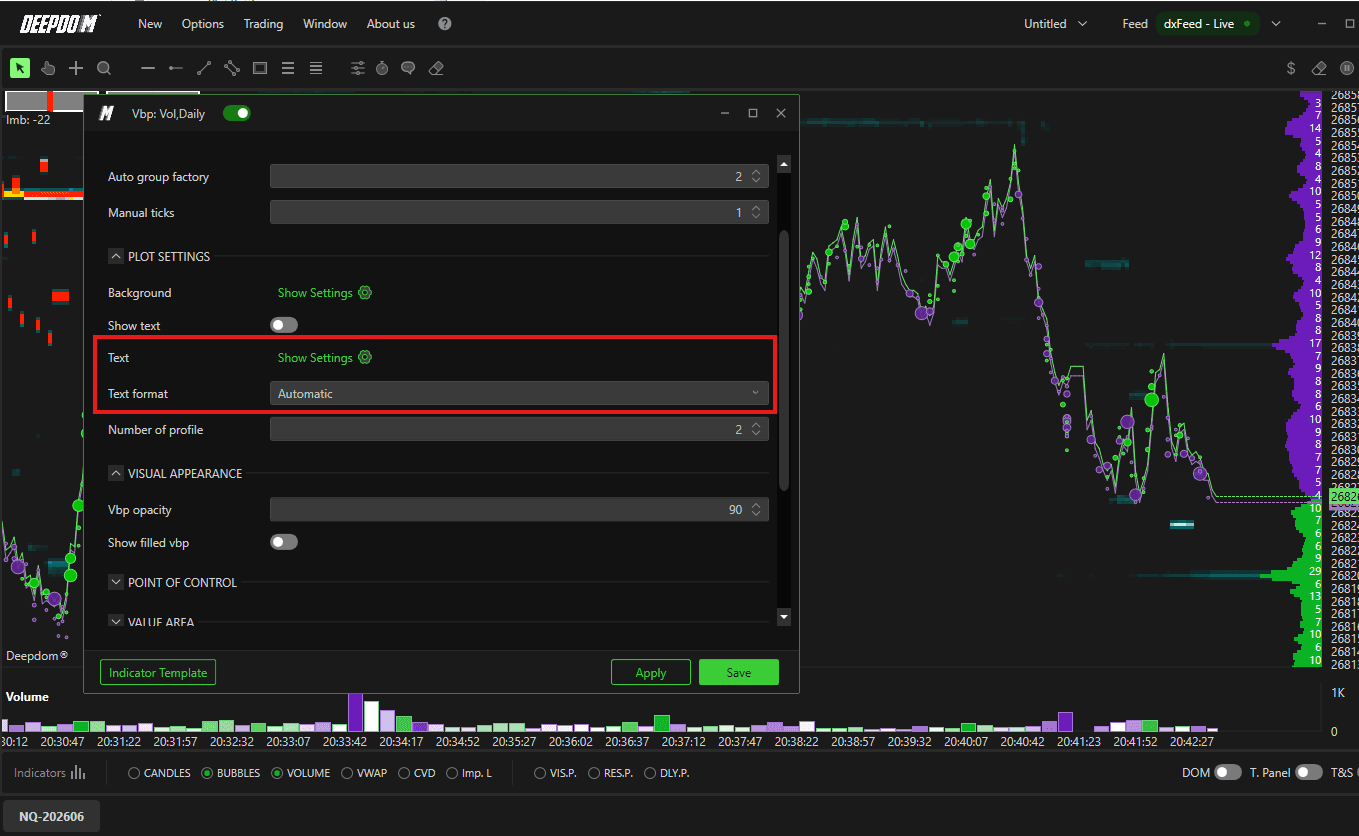
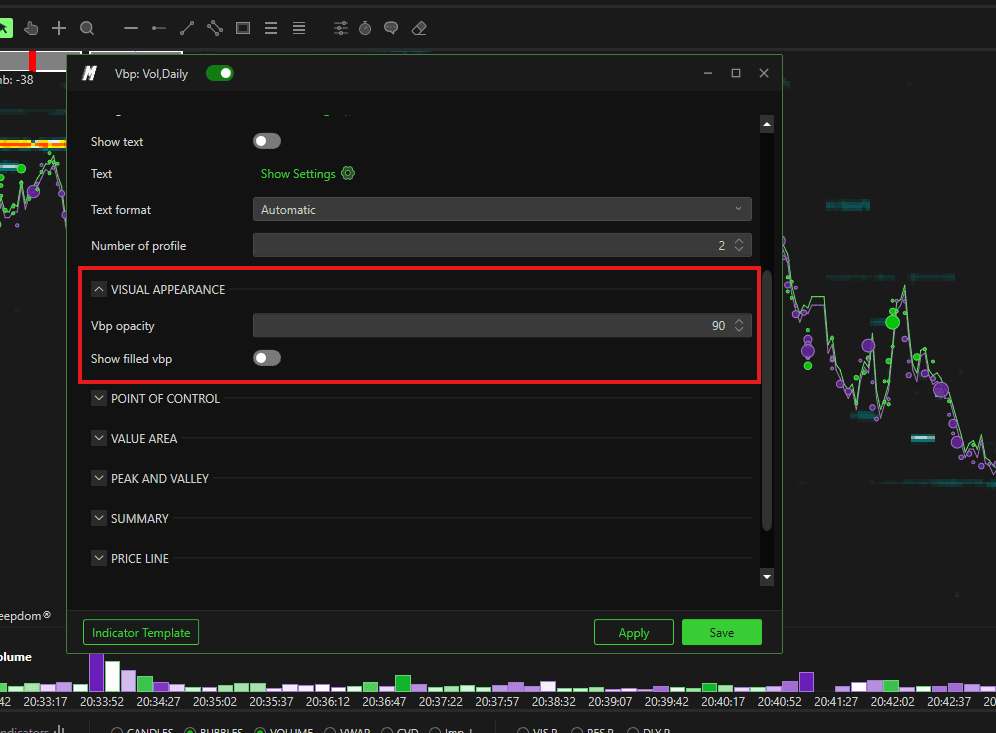
Visual Appearance
Vbp Opacity Controls how transparent or opaque the profile appears on the chart. Lower values make it more transparent; higher values make it more solid and visible.
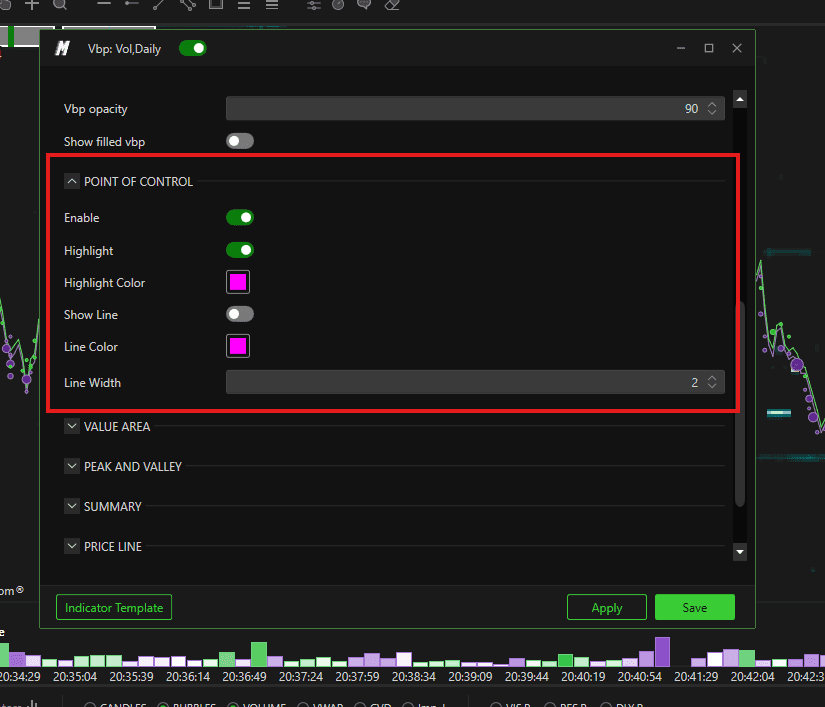
POC (Point of Control)
The POC is the price level with the highest traded volume in the profile. It is one of the most important reference levels in volume analysis.
Enable — show or hide the POC on the chart
Highlight — visually emphasize the POC bar within the profile to make it stand out
Highlight Color — set the color used for the POC highlight
Show Line — draw a horizontal line extending from the POC across the chart
Line Color — set the color of the POC line
Line Width — set the thickness of the POC line
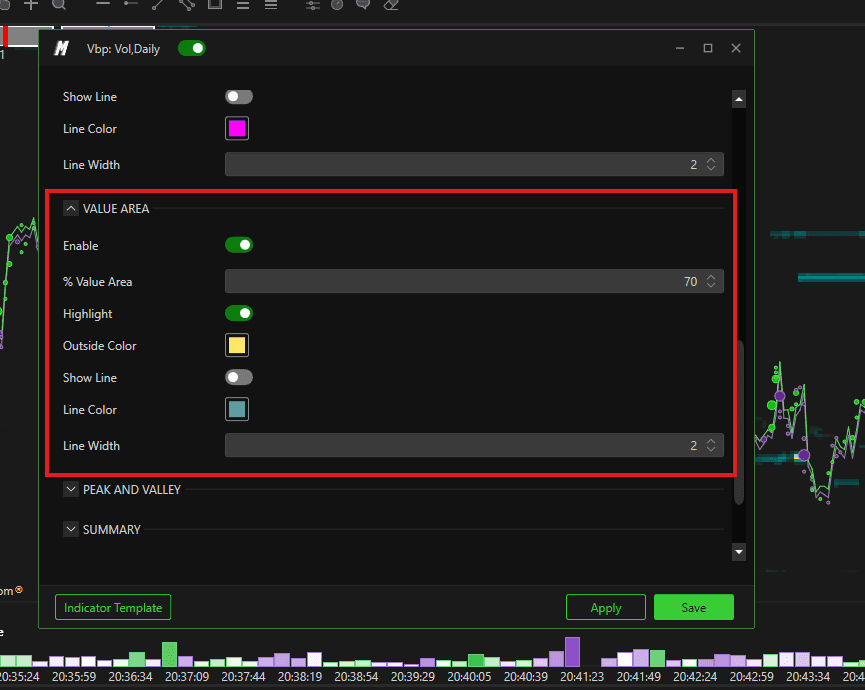
Value Area
The Value Area is the price range within which a defined percentage of total volume occurred. It represents the zone of greatest market acceptance.
Enable — show or hide the Value Area on the chart
% Value Area — set the percentage of total volume used to define the Value Area. The default is typically 70%, meaning the range within which 70% of all volume occurred
Highlight — visually highlight the Value Area on the candles
Outside Color — set the color applied to the area outside the Value Area, helping to distinguish it clearly
Show Line — draw lines marking the Value Area High (VAH) and Value Area Low (VAL)
Line Color — set the color of the Value Area boundary lines
Line Width — set the thickness of the Value Area boundary lines
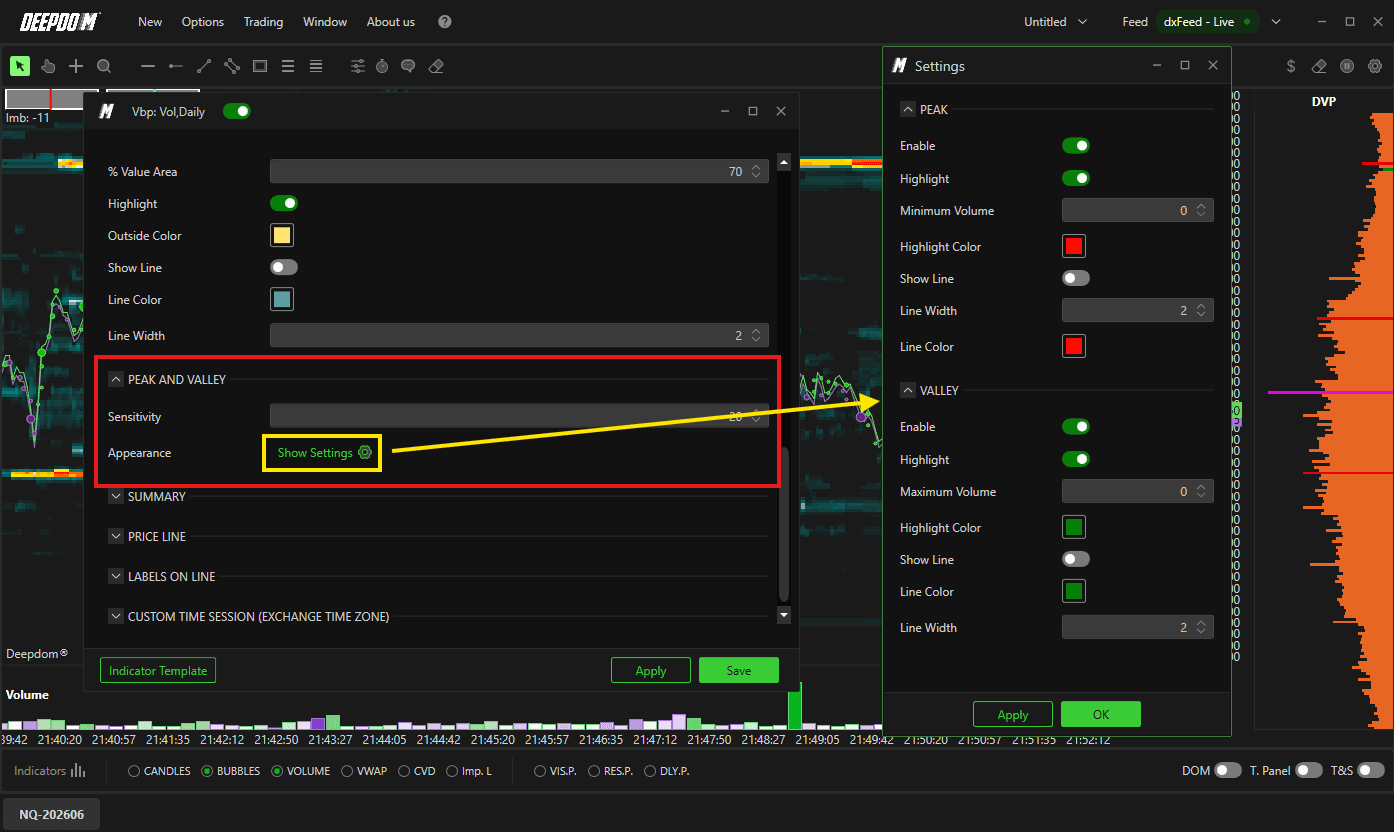
Peaks and Valleys
Peaks and Valleys highlight areas of high and low volume concentration within the profile:
Peaks — price levels where volume is heavily concentrated, often indicating strong market interest and potential support or resistance
Valleys — price levels where volume is very thin, often acting as void zones where price can move quickly
Sensitivity Controls how strictly peaks and valleys are identified. A higher value means fewer but more significant peaks and valleys. A lower value shows more levels with a looser filter.
Peak Settings
Highlight — visually mark peak levels on the profile
Minimum Volume — set a minimum volume threshold; peaks below this value will not be shown
Highlight Color — set the color for peak highlights
Show Line — draw a horizontal line at each peak level
Line Width — set the thickness of the peak line
Line Color — set the color of the peak line
Valley Settings
Highlight — visually mark valley levels on the profile
Minimum Volume — set a minimum volume threshold; valleys below this value will not be shown
Highlight Color — set the color for valley highlights
Show Line — draw a horizontal line at each valley level
Line Width — set the thickness of the valley line
Line Color — set the color of the valley line
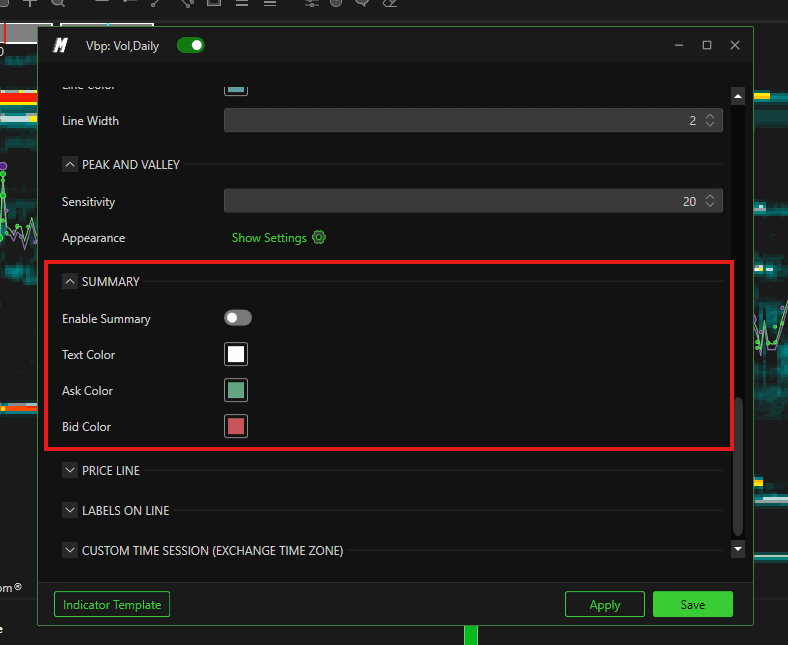
Summary
The Summary displays a detailed data panel for each volume profile on the chart, including total volume, delta, number of trades, number of ticks, and other statistics. This makes it easy to compare activity across different sessions or time periods at a glance.
Enable Summary — show or hide the summary panel for each profile
Text Color — set the color of the summary text
Ask Color — set the color representing Ask volume in the summary
Bid Color — set the color representing Bid volume in the summary
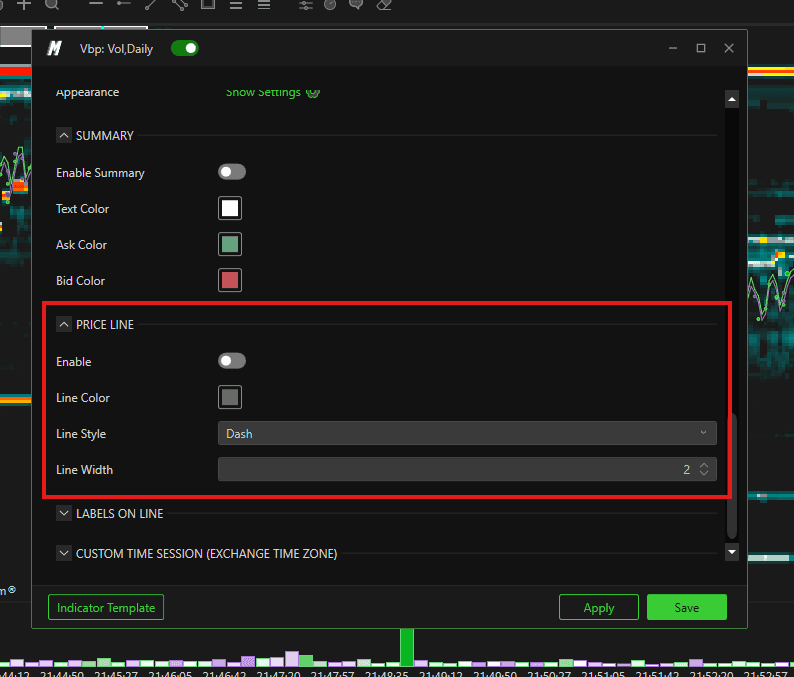
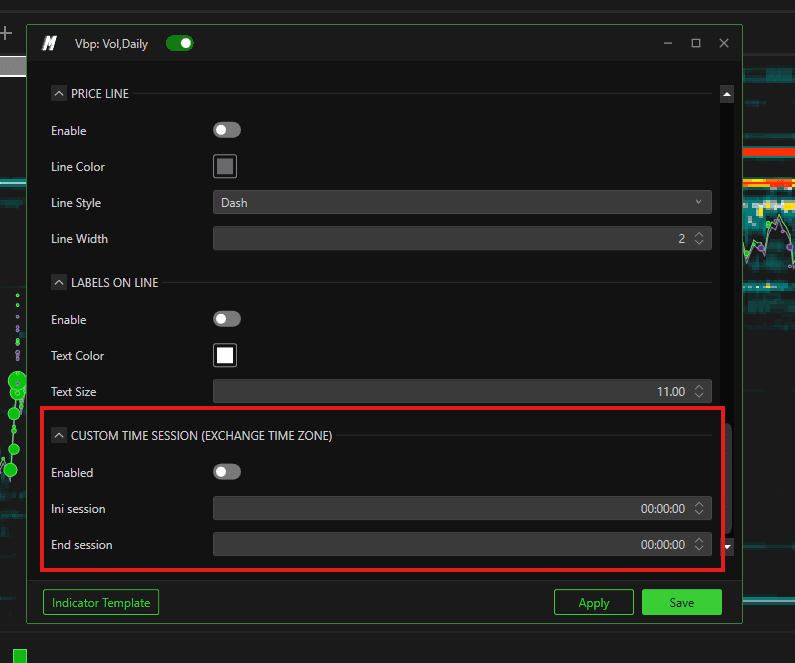
Price Line
Enables a price line within the vertical chart area of the Volume Profile.
Enable — show or hide the price line
Line Color — set the color of the line
Line Style — choose the line style: solid, hatch, dot, dash dot, or dash dot dot
Line Width — set the thickness of the line
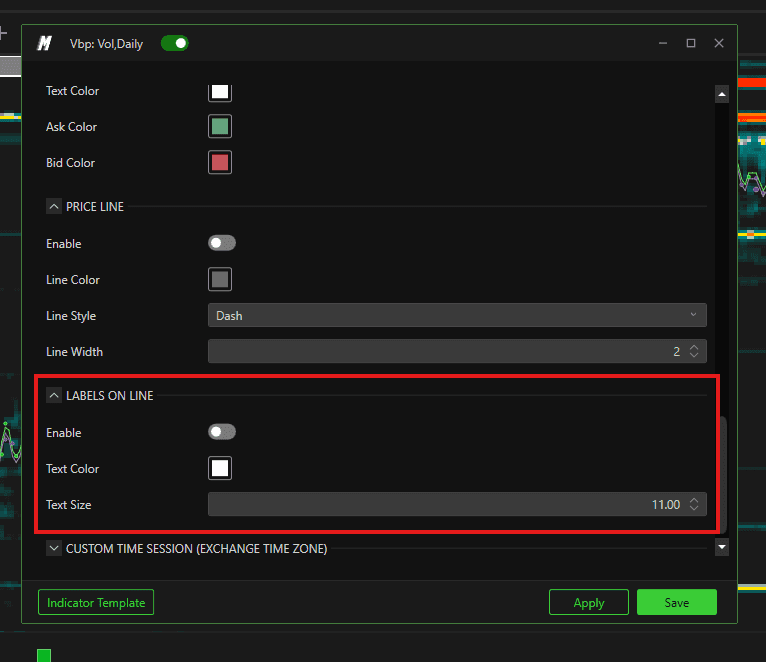
Labels on Line
Text Color — edit the color of the lines
Text on Line — enables labels on lines derived from the Volume Profile, such as the VPOC and Value Area High/Low labels
Custom Time Session (Exchange Time Zone)
Allows you to define a specific session window for the Volume Profile calculation, rather than using the full chart period.
Enable — activate the custom time mode
Ini Session — set the start time of the trading session. Always enter the time in U.S. market time — for example, 9:30 a.m. for U.S. futures
End Session — set the end time of the trading session, also in U.S. market time
Conclusion
The Deep Profile indicator is one of the most comprehensive tools available in DeepDom for understanding market structure. By identifying where volume has concentrated and where it is absent, you gain a significant edge in locating meaningful support and resistance levels, planning entries, and understanding the overall context of price action.
Still Having Trouble?
Our support team is available 24/7 and ready to help you with any issue you encounter.
When reaching out, please include:
A screenshot of the issue
A brief description of what you were trying to do
Support Ticket (Fastest Response) Visit www.deepcharts.com and create a support ticket directly on our website.
Email Support Reach us at support@deepcharts.com — please note that email responses may take a little longer than a support ticket.