Features
Updated:
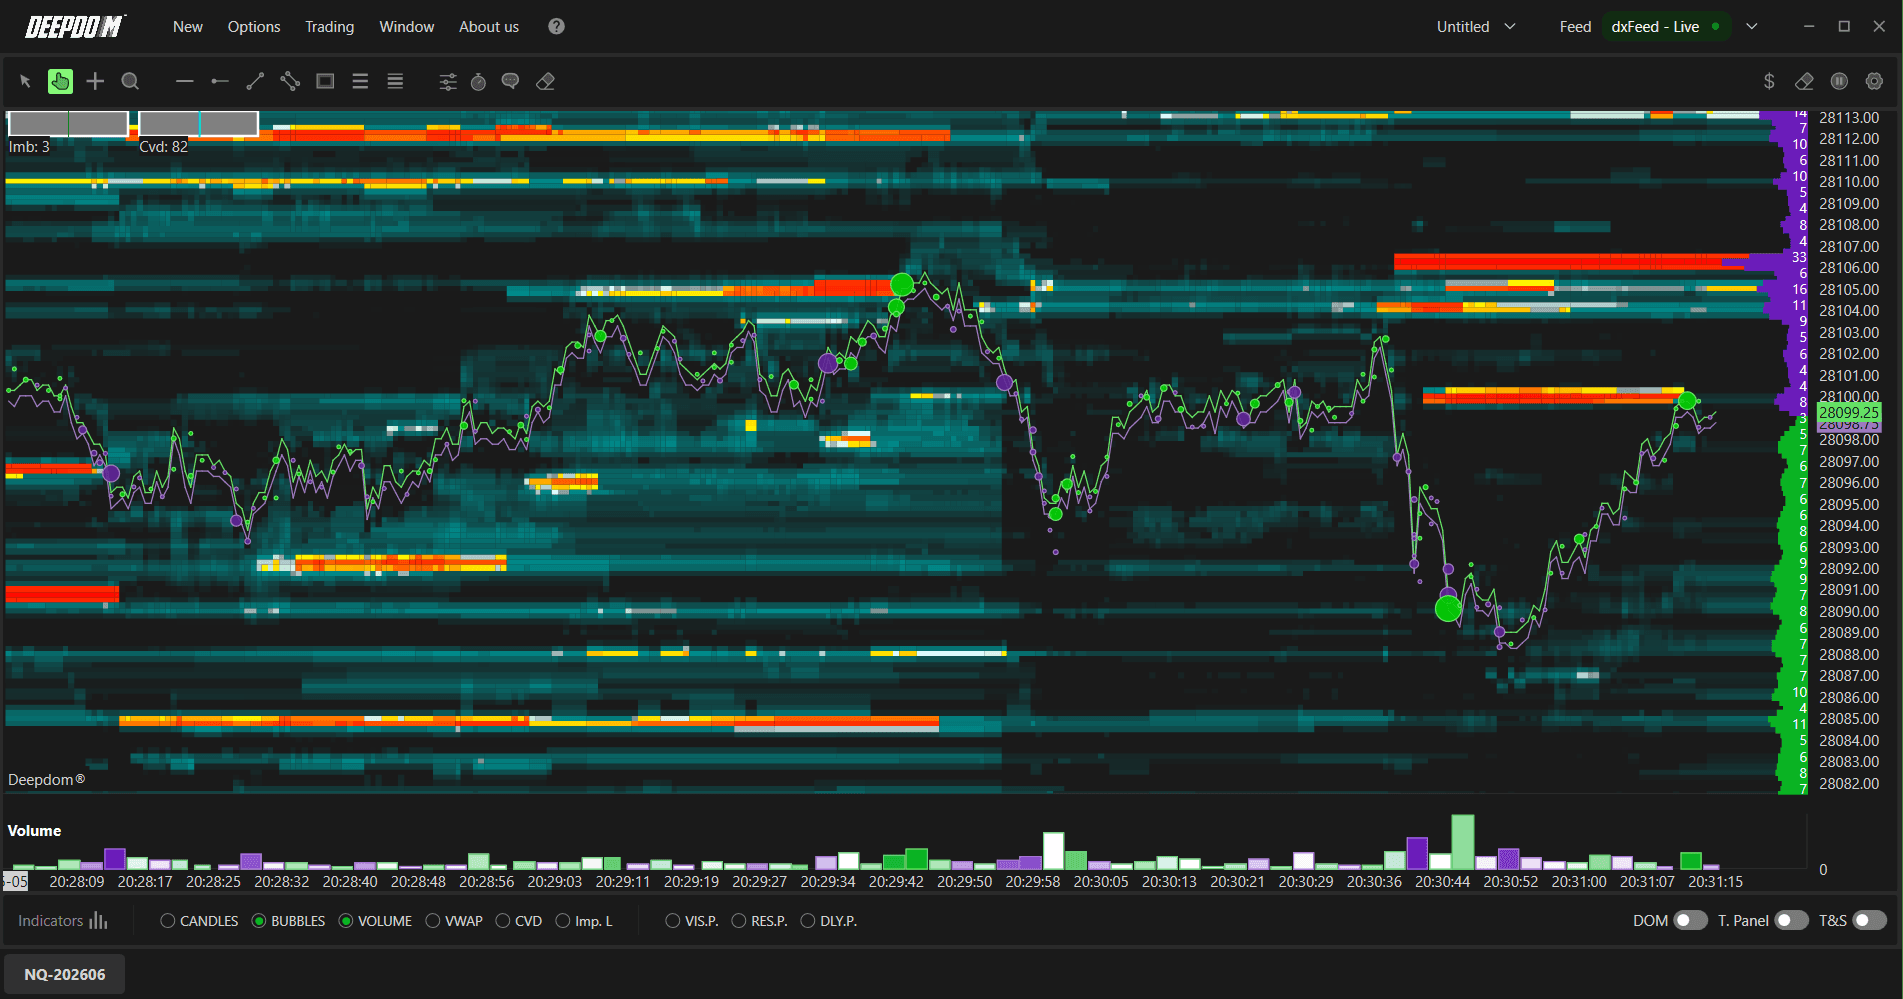
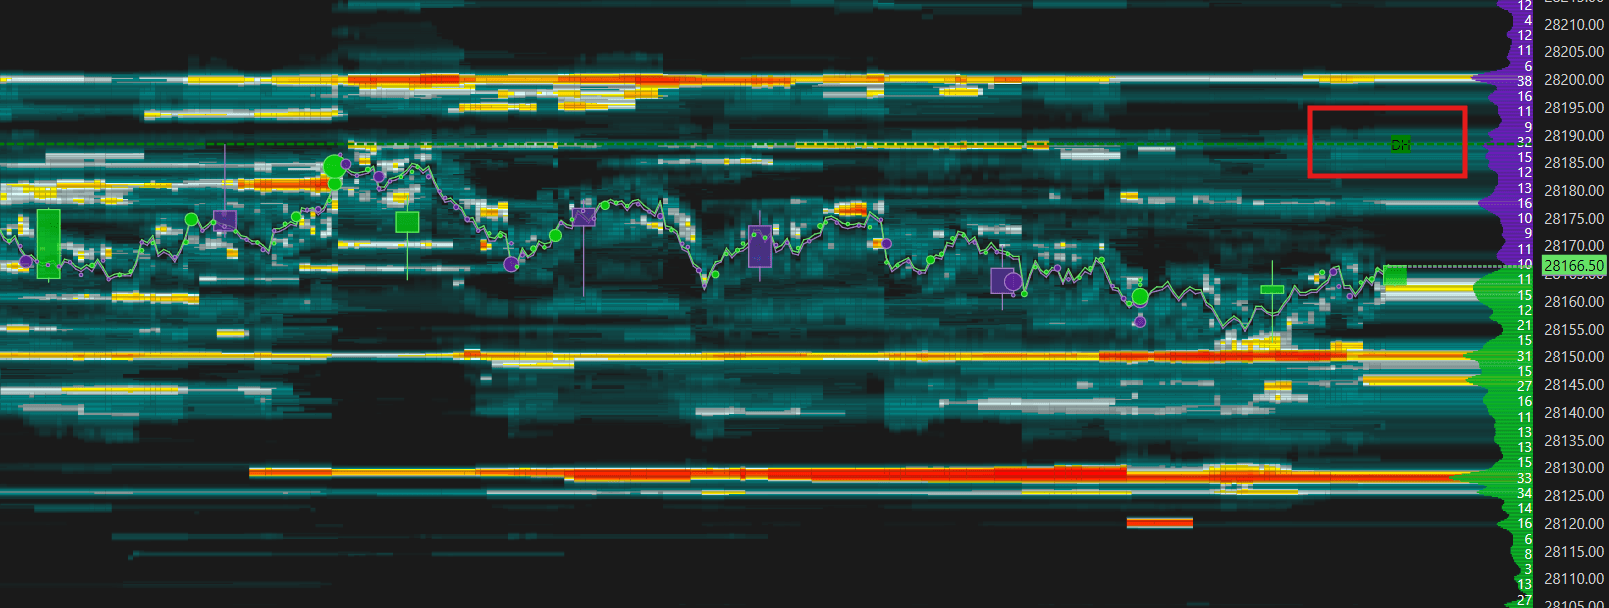
The Heatmap is DeepDom's most powerful tool for analyzing trading volumes and order flow. It combines executed market order data (from Time & Sales) with limit order data from the Trading Book (DOM), giving you a complete picture of market activity in real time.
Opening a Heatmap
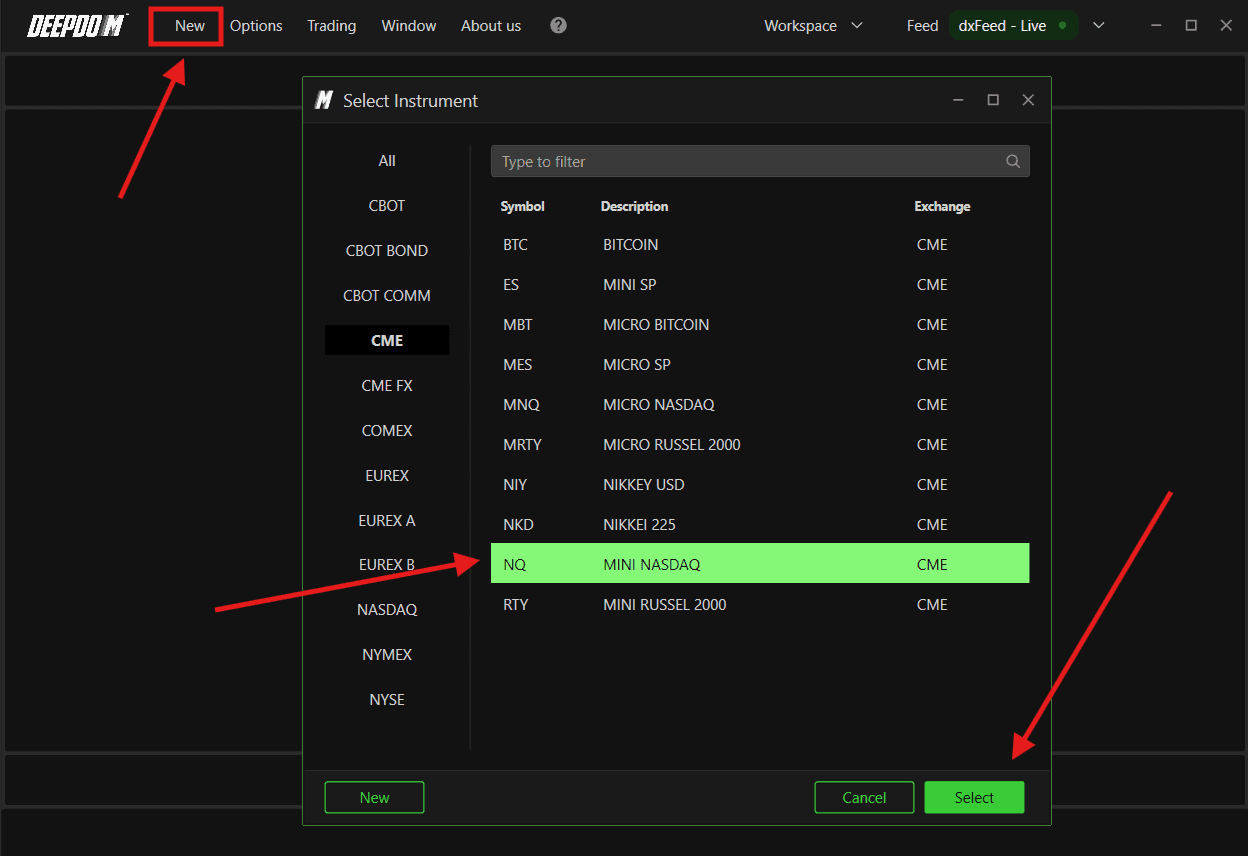
After connecting your data feed, follow these steps to open a new chart:
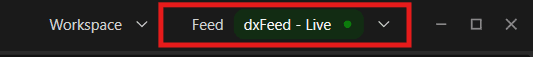
Connect the datafeed first, make-sure its green (connect), If the connection - Yellow (Still Looking for the connections), and Red (Connection is disconnected)
Click New in DeepDom
Select the financial instrument you want to display from your list of subscribed symbols (Make-sure you have setup your Symbol Manage setting correctly
Click Select at the bottom right to confirm
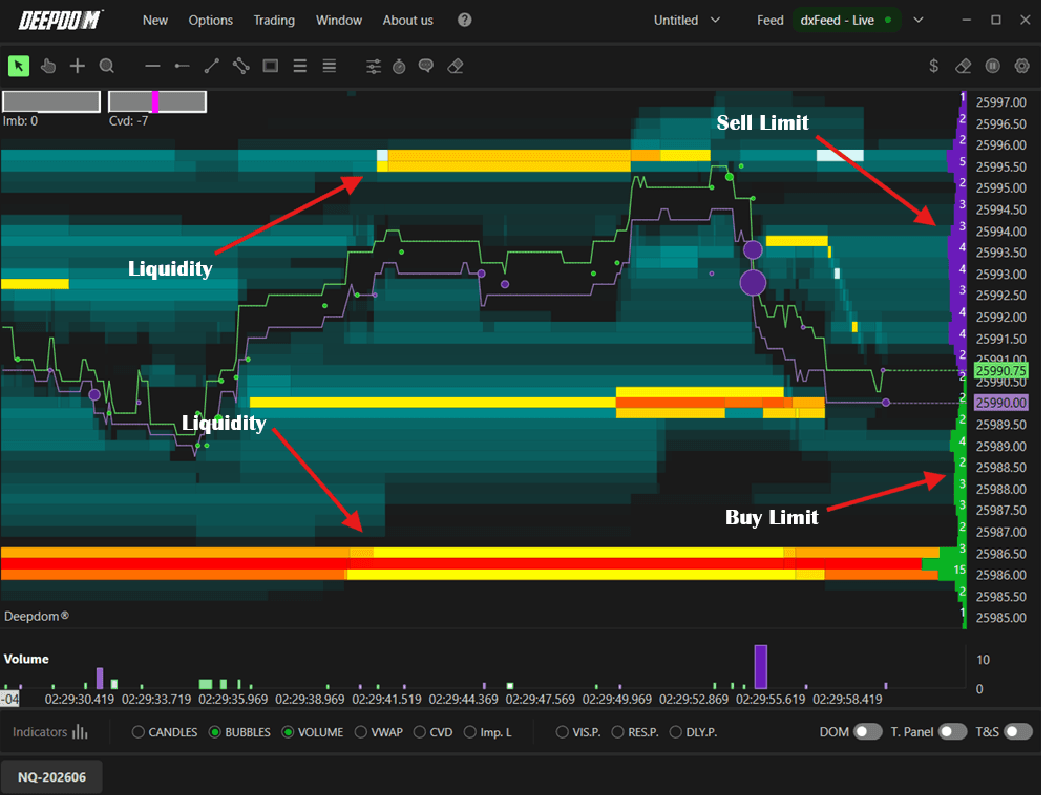
Understanding Liquidity
By default, the chart opens with one hour of history. Limit orders from the DOM are displayed directly on the chart:
Violet = Sell Limit orders
Green = Buy Limit orders
The Heatmap doesn't just show current limit orders — it saves and plots this information over time, so you can see how liquidity has built up, increased, decreased, or been cleared at any price level.
DeepDom uses a color scale to show the intensity of liquidity at each price level:
Red = highest liquidity
Orange = second highest
Yellow, White, Blue, Black = progressively lower levels
These colors adjust automatically to current market conditions. If a new large limit order appears, the entire color scale shifts to reflect the new context.
Note: To access Market Depth data, you need Level 2 from your data feed. DeepDom supports analysis of over 1,000 book levels.
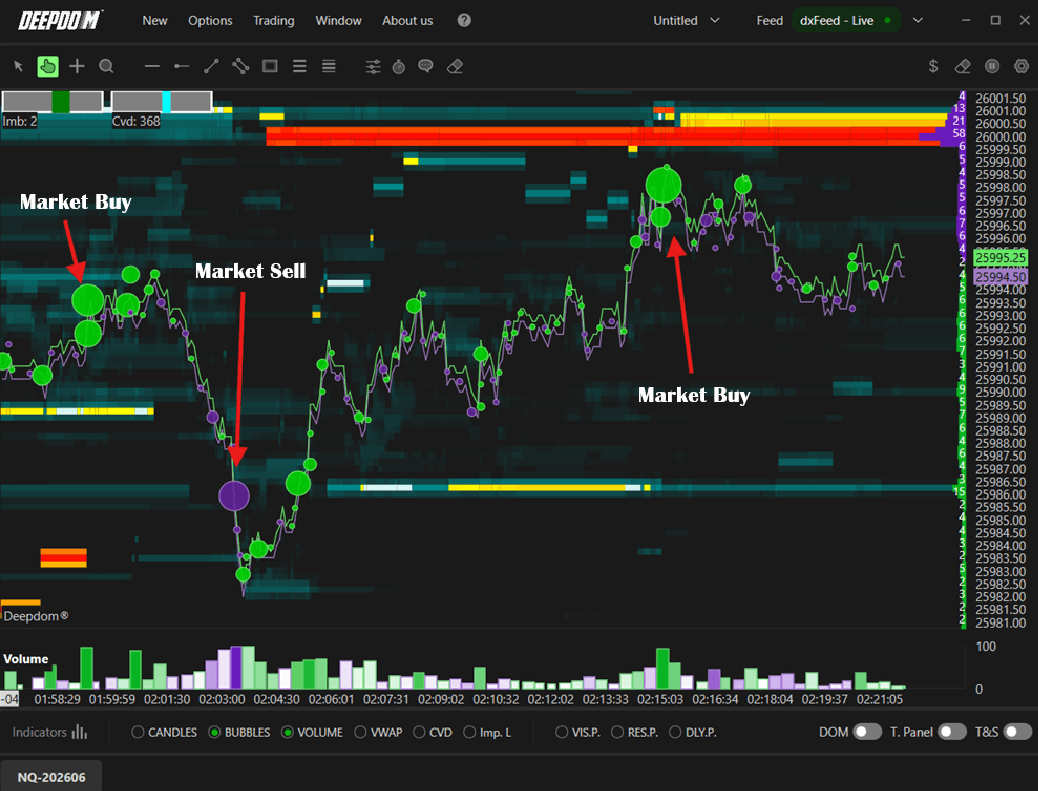
Volume Bubbles
Volume Bubbles show tick-by-tick market executions directly on the chart:
Green bubble = Buy market order (executed at Ask)
Violet bubble = Sell market order (executed at Bid)
Bubble size = proportional to the size of the execution
This gives you an immediate visual sense of where and how aggressively the market is trading.
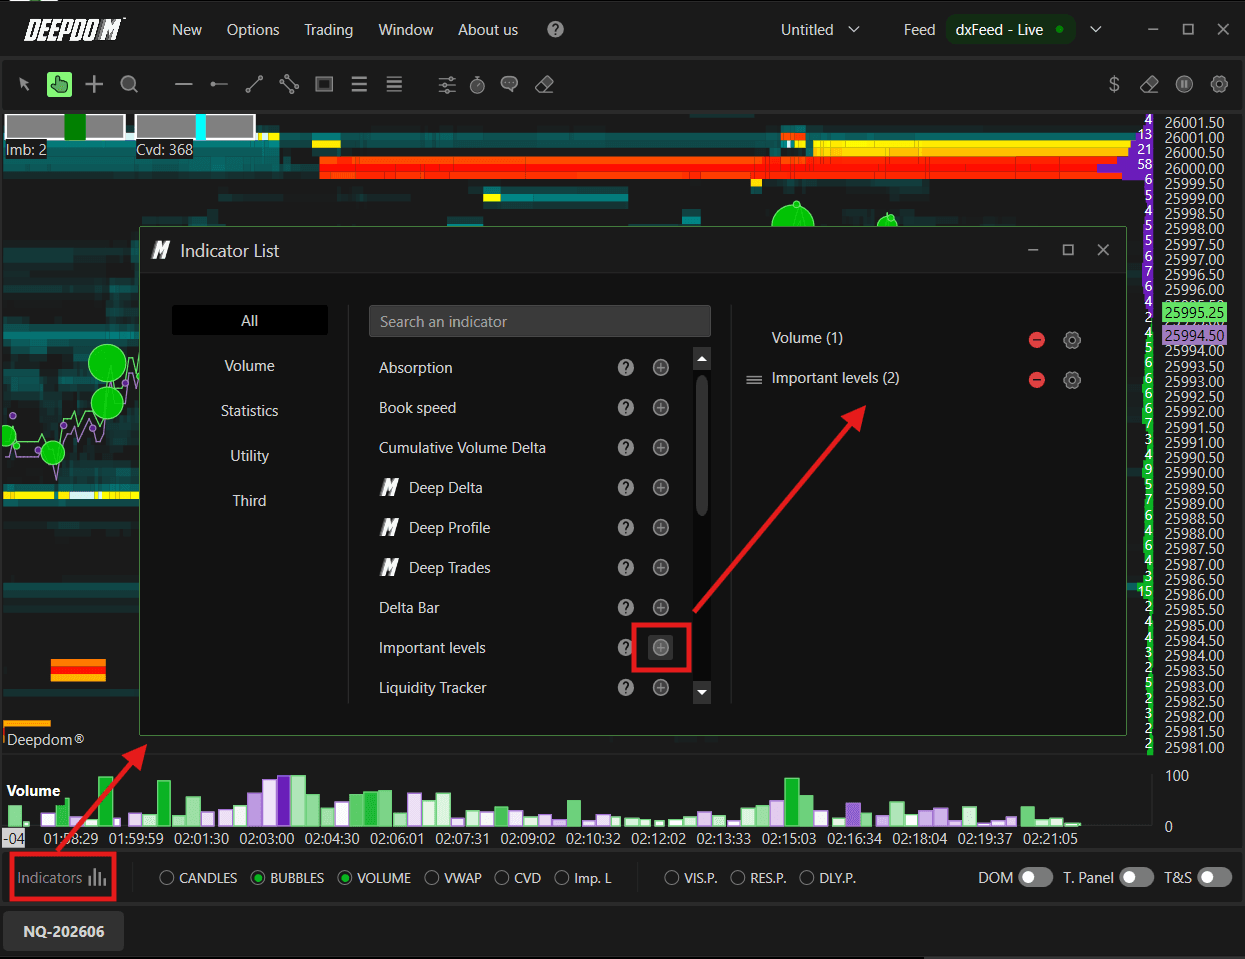
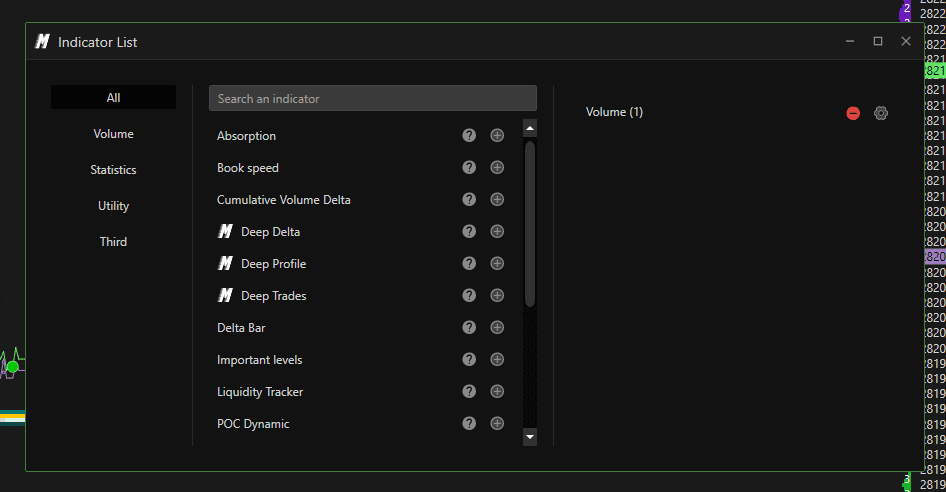
Indicators
Adding a New Indicator
Click Indicators in the lower left corner of the chart
A window will open with the full list of available indicators
Click the + next to any indicator to add it to the chart
Once added, you can adjust its settings or remove it at any time
Indicator Toolbar
At the bottom of the chart there is a quick-access Toolbar. Here is what each button does:
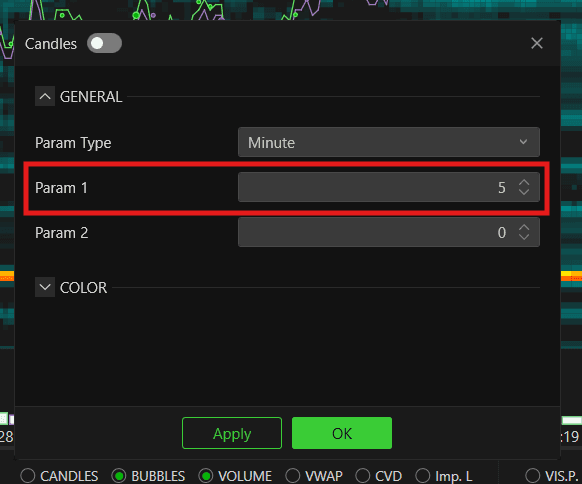
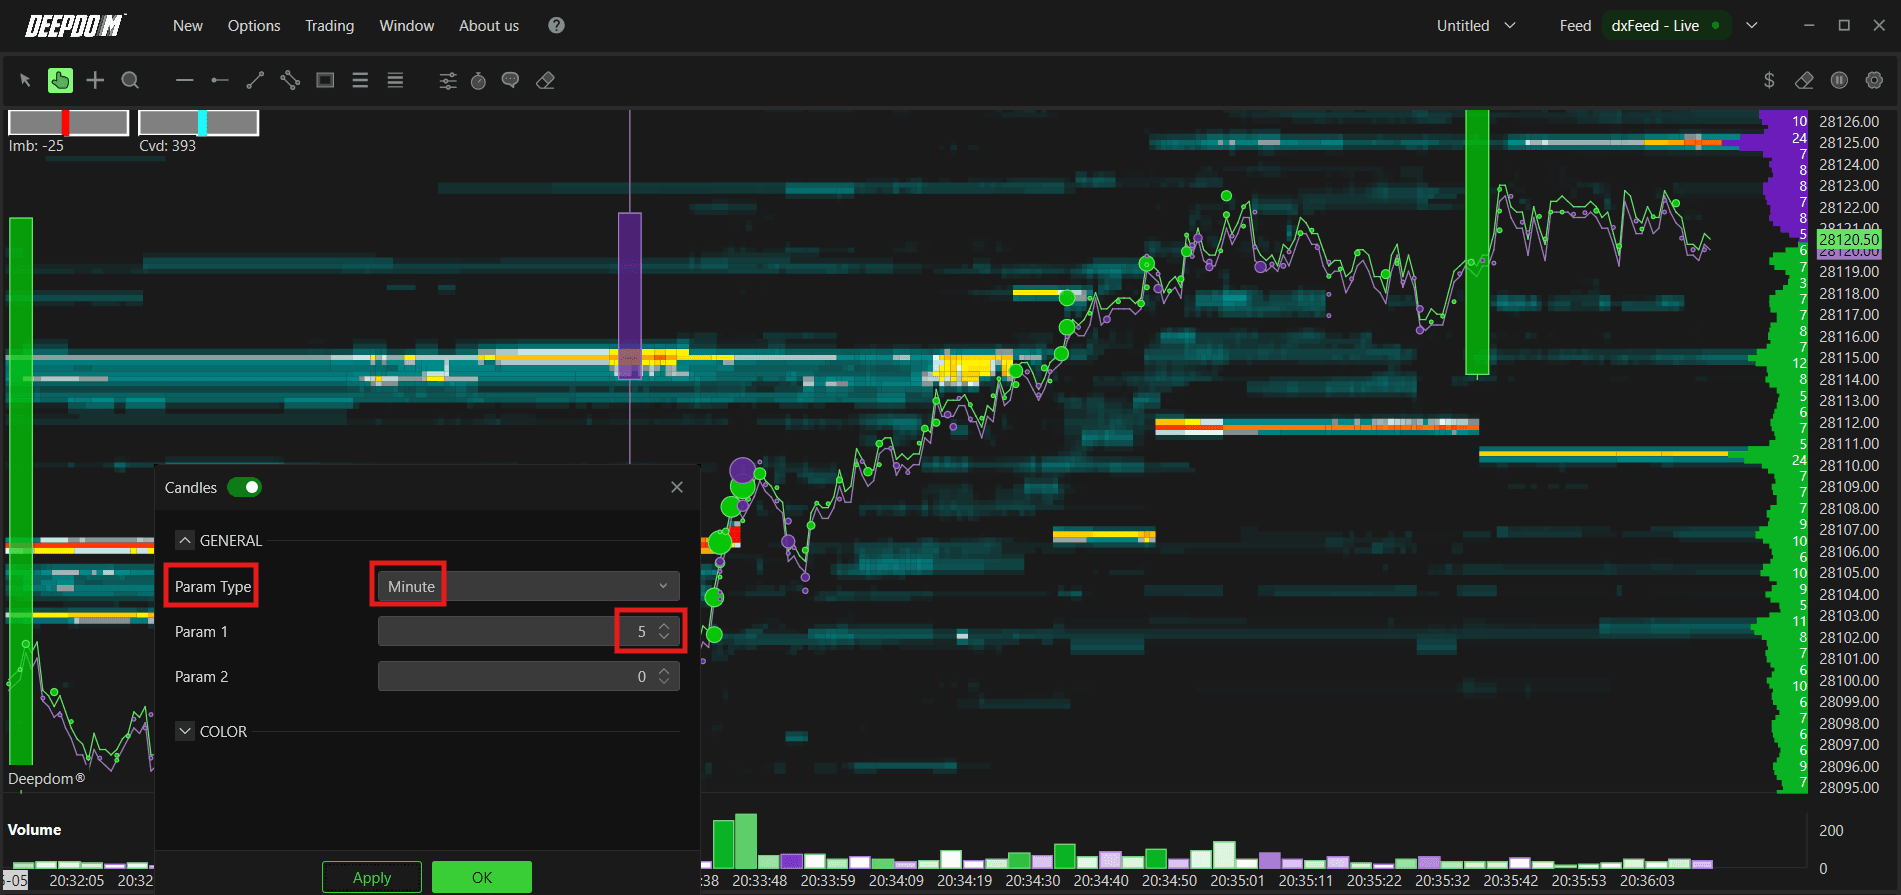
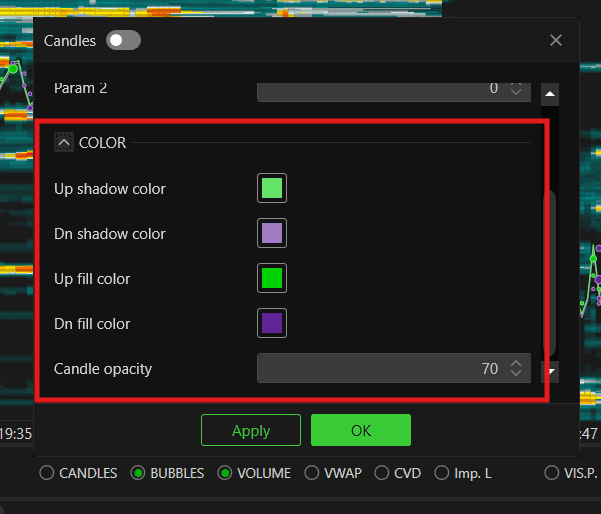
1. Candles Enables classic Japanese candlesticks. You can define their parameters and customize their colors.
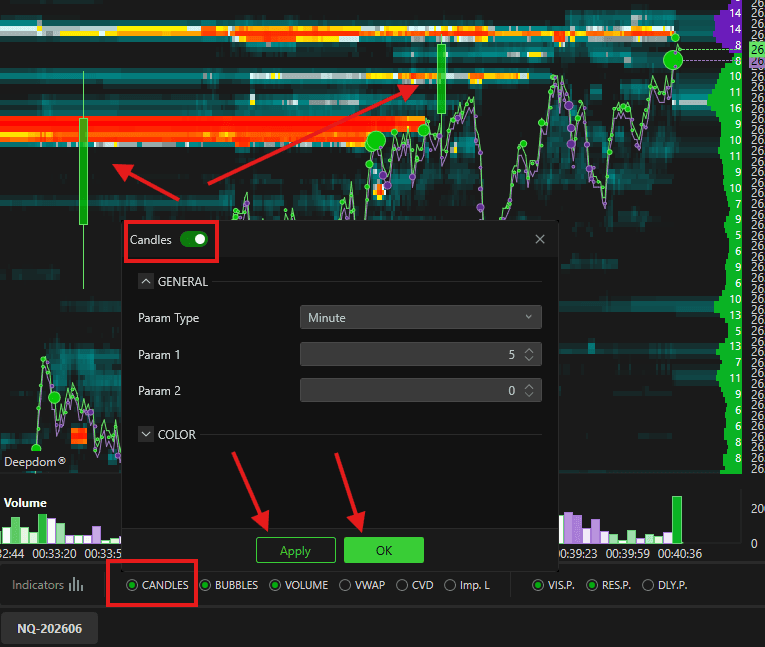
Param Type -
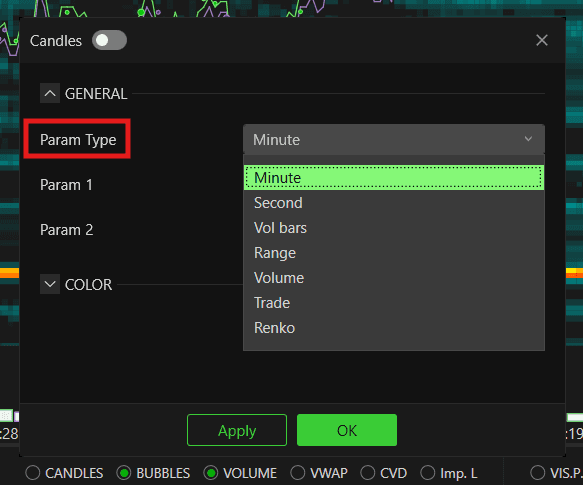
If you choose,Minin Param Type >> you can add the Candle Value inParam 1
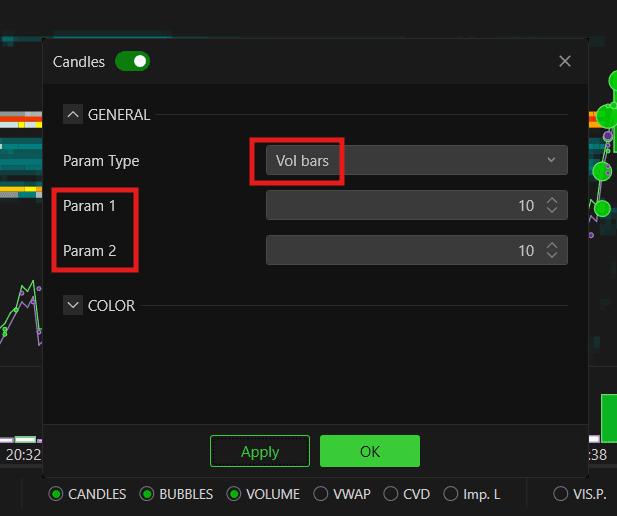
If you choose, Vol BarinParam Type- You can add the Candle Value inParam 1andParam 2
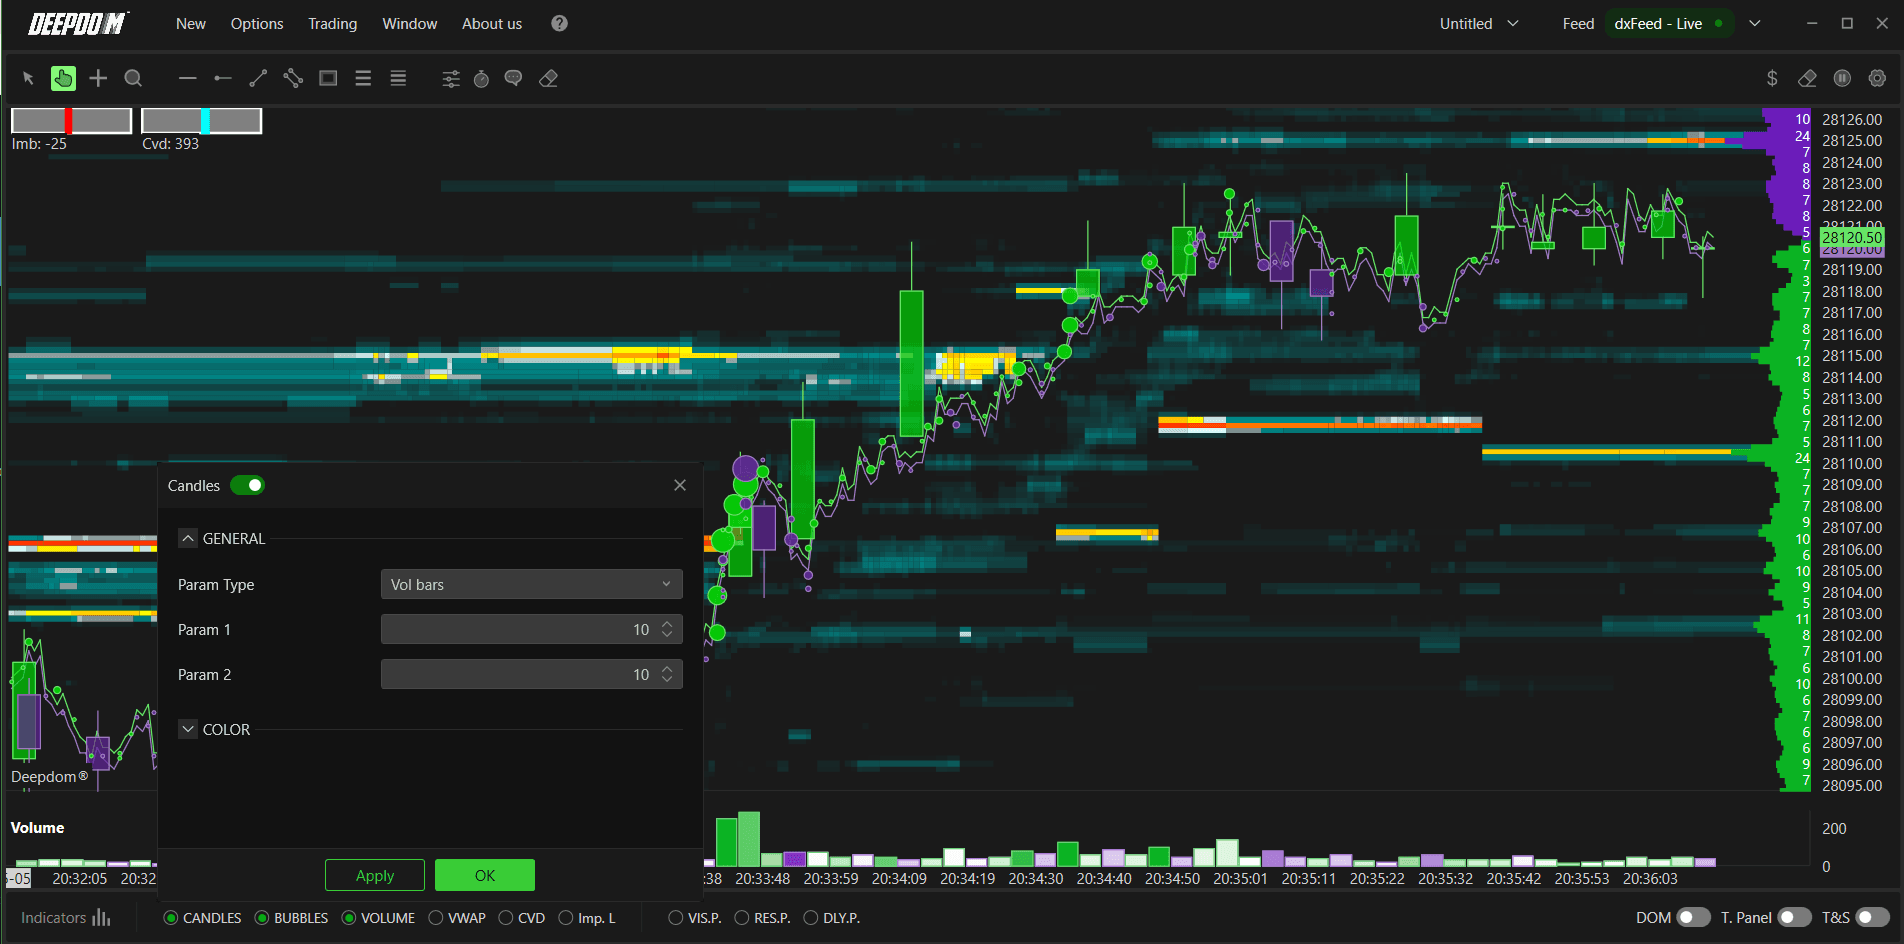
Color Setting
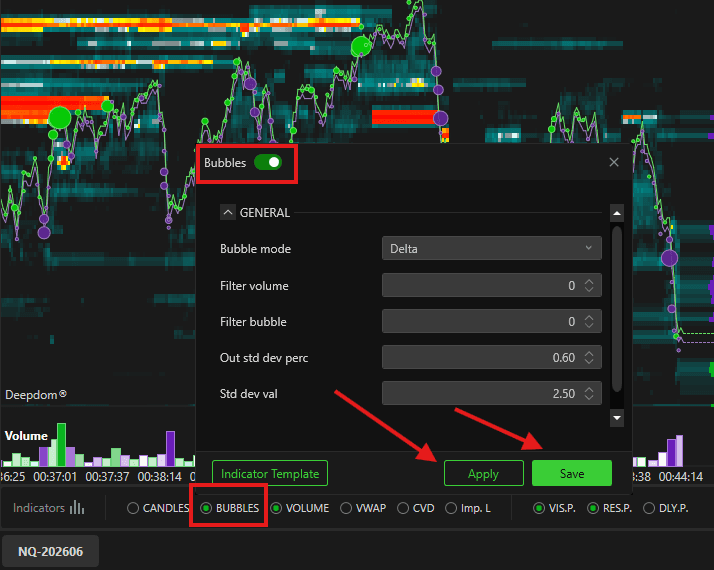
2. Bubbles Enables Volume Bubbles and lets you define their main settings:
Bubbles Mode — choose between showing the Delta of each bubble or the Bid/Ask split
Filter Volume — sets the minimum volume threshold to display a bubble
Filter Bubble — sets the minimum size for a bubble to appear
Out Std Dev % and Value Dev Std — define the standard deviation values that control bubble sizing
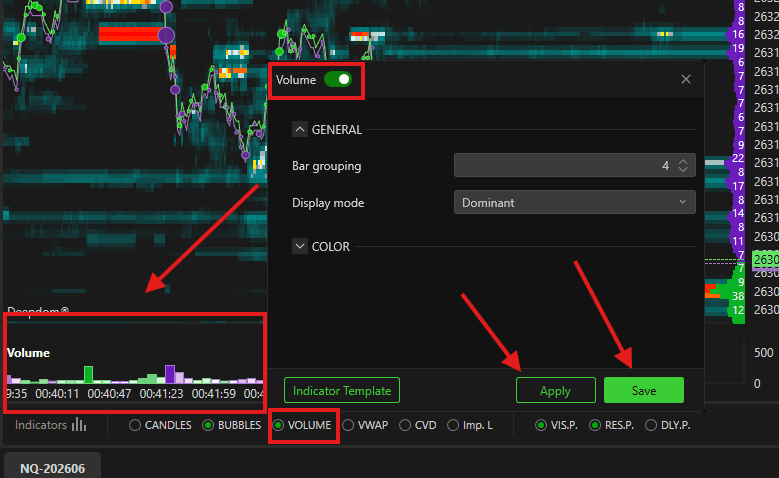
3. Volume Enables the Volume bar at the bottom of the chart. You can set the grouping and choose the display mode — Delta Dominant or Split.
4. VWAP Quickly enables the VWAP indicator and lets you define its main parameters.
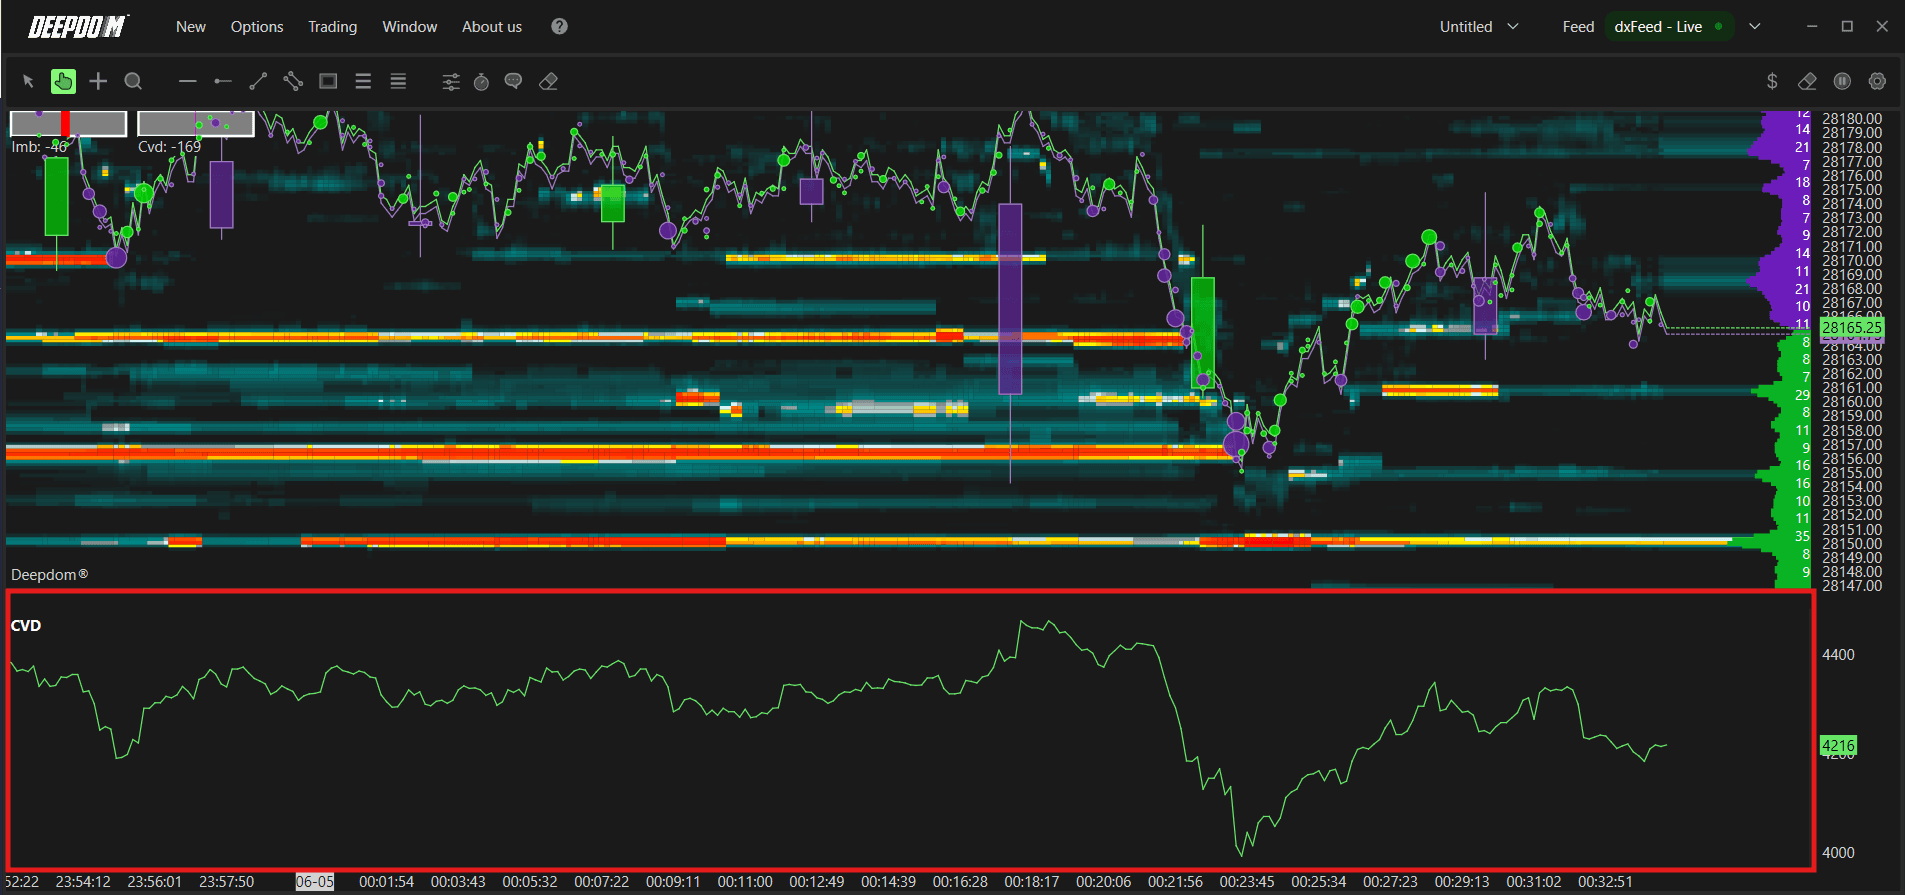
5. CVD — Cumulative Volume Delta Quickly enables the Cumulative Volume Delta (CVD) and lets you define its main parameters.
Once enabled, click the settings icon to configure:

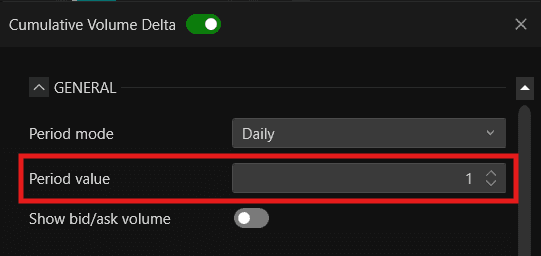
General
Period Mode — defines the time period for the CVD calculation. You can choose Daily, Minutes, Seconds, or Orders
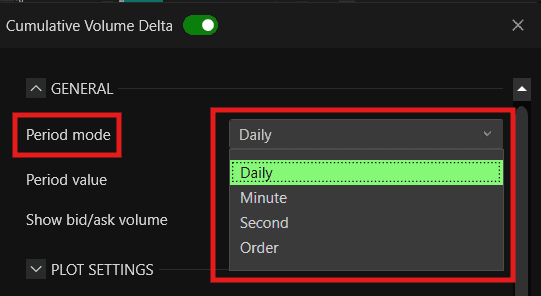
Period Value — sets the numeric value for the period chosen above
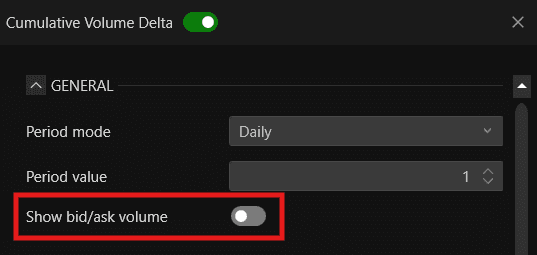
Show Bid/Ask Volume — when enabled, displays the Bid and Ask volume separately alongside the delta
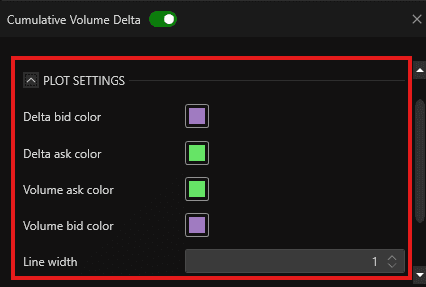
Plot Settings
Delta Bid Color — sets the color for the delta on the Bid side
Delta Ask Color — sets the color for the delta on the Ask side
Volume Ask Color — sets the color for the Ask volume line
Volume Bid Color — sets the color for the Bid volume line
Line Width — sets the thickness of the CVD lines
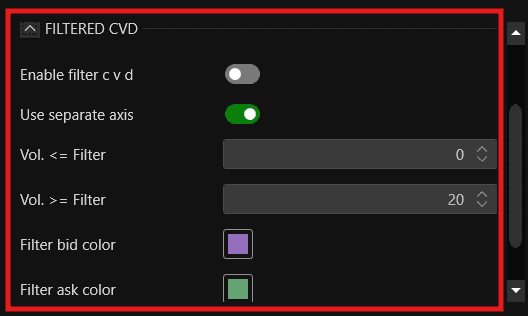
Filtered CVD
Enable Filter CVD — when enabled, applies a volume filter to the CVD calculation, showing only trades that meet the defined volume criteria
Use Separate Axis — when enabled, the filtered CVD is plotted on its own axis separately from the main CVD
Vol. <= Filter — sets the maximum volume threshold for the filter
Vol. >= Filter — sets the minimum volume threshold for the filter
Filter Bid Color — sets the color for the filtered Bid delta
Filter Ask Color — sets the color for the filtered Ask delta
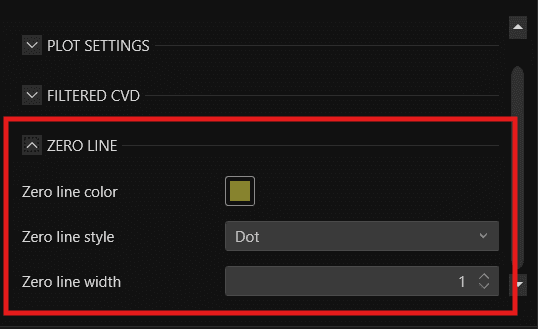
Zero Line
Zero Line Color — sets the color of the zero line
Zero Line Style — sets the style of the zero line — Solid, Dash, Dot, Dash Dot, or Dash Dot Dot
Zero Line Width — sets the thickness of the zero line
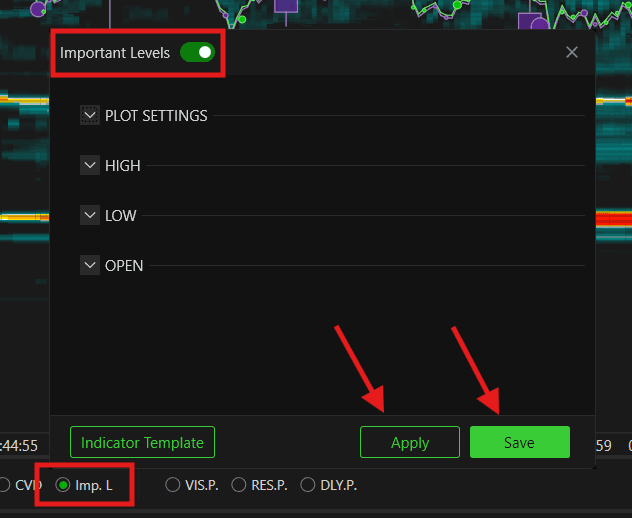
6.Imp L. — Important Levels Quickly enables Important Levels for the session — session high, low, and open. Once enabled, click the settings icon to configure:
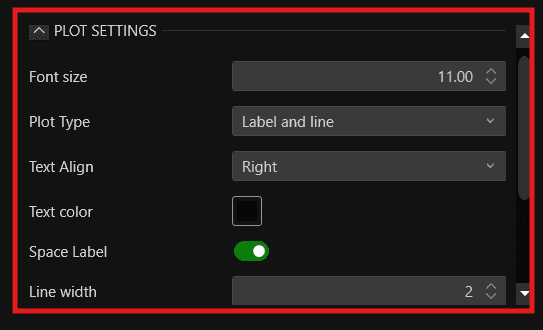
Plot Settings
Font Size — sets the size of the text labels displayed next to each level
Plot Type — defines how the level is displayed on the chart. You can choose between Label and Line, Label only, or Line only
Text Align — sets the alignment of the text label. You can choose between Left, Center, or Right
Text Color — sets the color of the text labels
Space Label — when enabled, adds spacing between the label and the line for better readability
Line Width — sets the thickness of the level lines
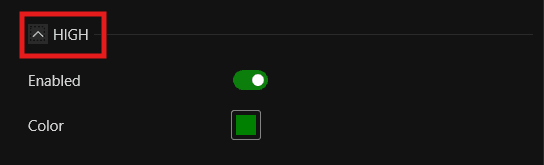
High
Enabled — show or hide the session High level on the chart
Color — sets the color of the session High line
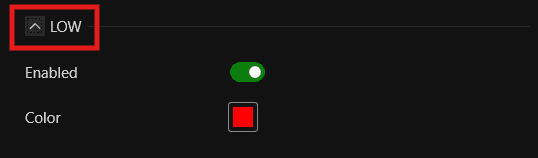
Low
Enabled — show or hide the session Low level on the chart
Color — sets the color of the session Low line
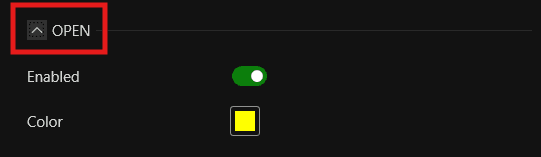
Open
Enabled — show or hide the session Open level on the chart
Color — sets the color of the session Open line
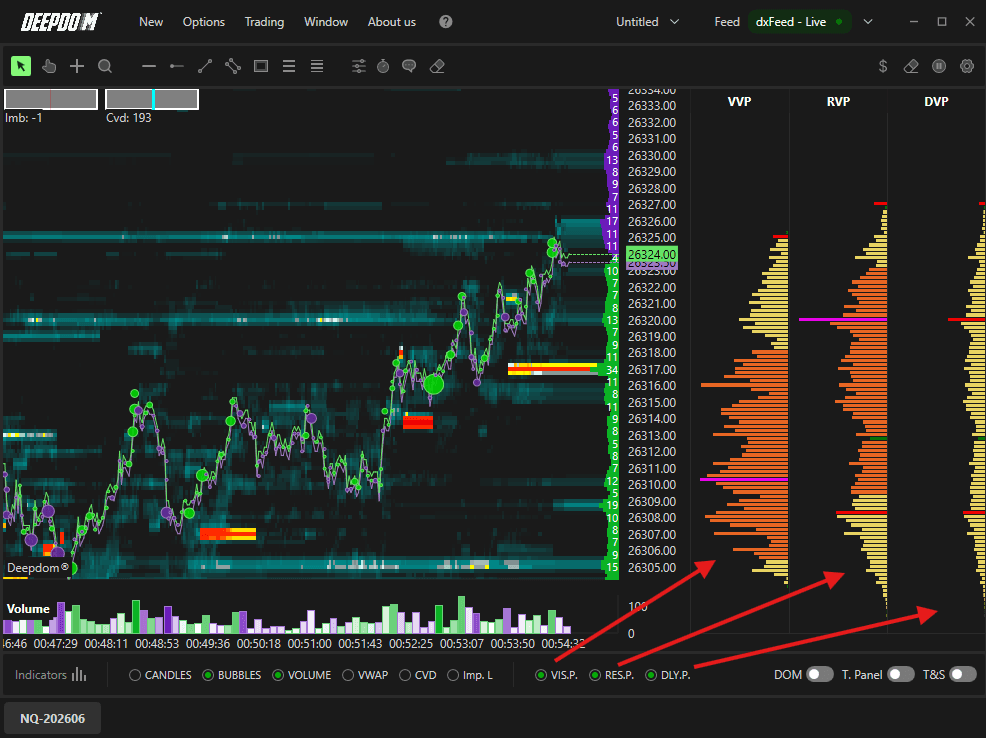
7. VIS. P. — Visible Profile Enables the Visible Profile. You can choose the profile type to display:
Volume
Delta
Delta and Total Volumes
Bid/Ask Volume
8. RES. P. — Resettable Profile Enables the Resettable Profile — a Volume Profile that you can manually reset at any point to start calculating from that moment forward. This is useful when you want to measure volume distribution from a specific event or time — for example, from the moment a key news release hits. It has the same display options as the Visible Profile.
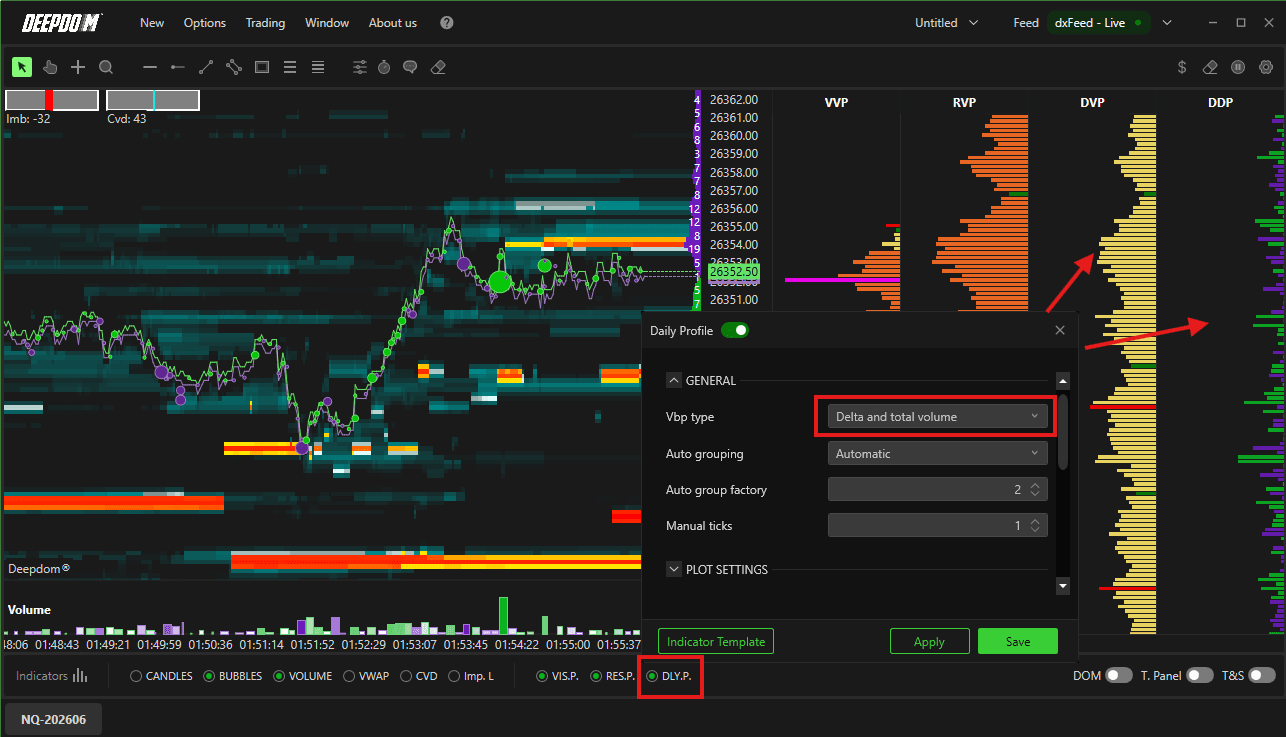
9. DLY. P. — Daily Profile Enables the Daily Profile with the same display options as above. (Ask Antonio, how its showing daily profile >> Because deepdom only shows 2hours of data when its open freshly)
Note: To display both the Volume Profile and the Delta Profile at the same time, select Delta and Total Volumes in the profile type selector.
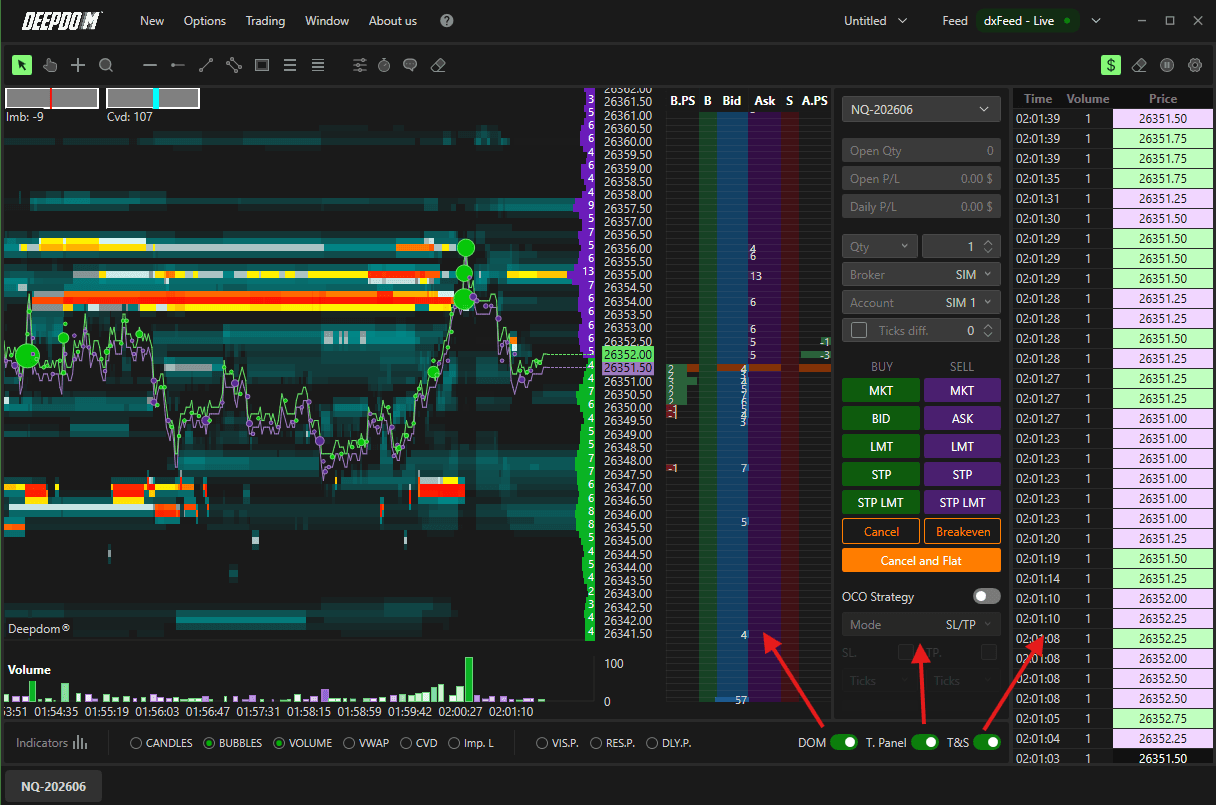
10. DOM Enables the Chart DOM (Depth of Market) directly on the chart.
11. T. Panel Enables the Trading Panel.
12. T&S Enables the Time and Sales panel.
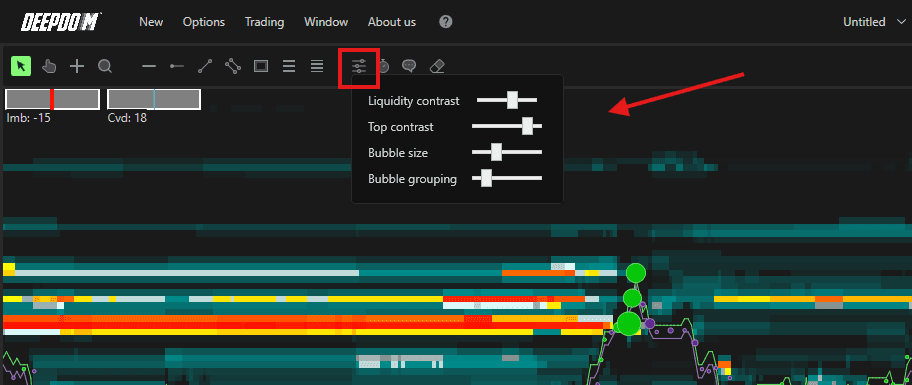
13. Sliders Lets you adjust the visual settings of the Heatmap:
Liquidity Contrast — adjust the contrast of the liquidity colors
Top Contrast — set the upper contrast limit
Bubble Size — increase or decrease the size of Volume Bubbles
Bubble Grouping — define how price levels are grouped
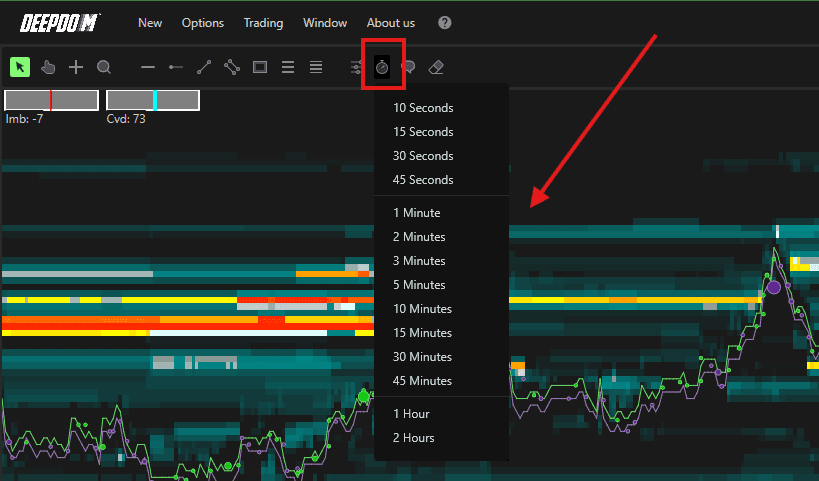
14. Watch Lets you quickly define and zoom into a specific portion of the chart in a semi-automatic way.
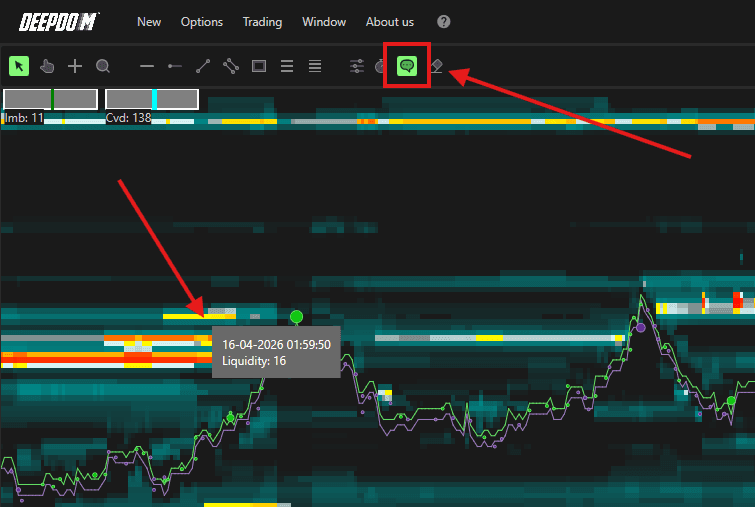
15. Text Displays textual information about the liquidity and traded volume at the point where your cursor is positioned. Useful for a deeper understanding of Order Flow dynamics.
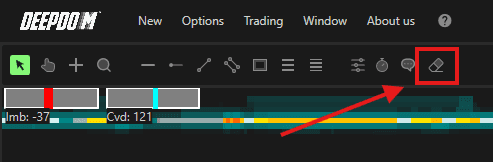
16. Eraser Deletes all annotations currently drawn on the chart.
Navigating the Chart
X-Axis (Time) Scroll with the mouse wheel to move left or right along the time axis.
Y-Axis (Price) Right-click on the price scale to choose how you want to interact with it:
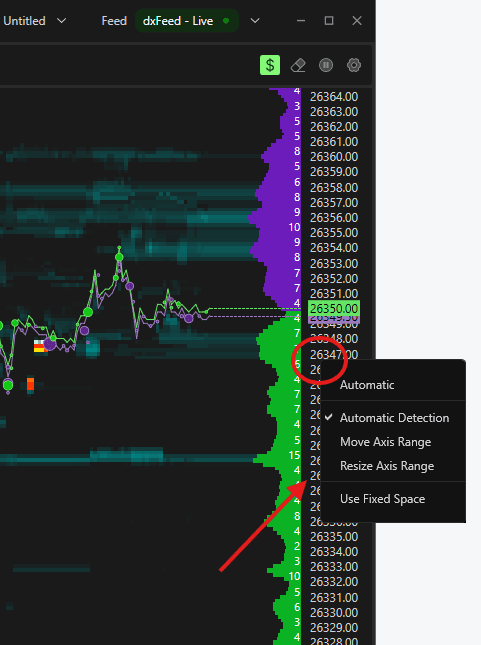
Self-Recognition Mode — position your cursor in the middle of the Y-axis and left-click to move it. Position at the top or bottom edge to resize it
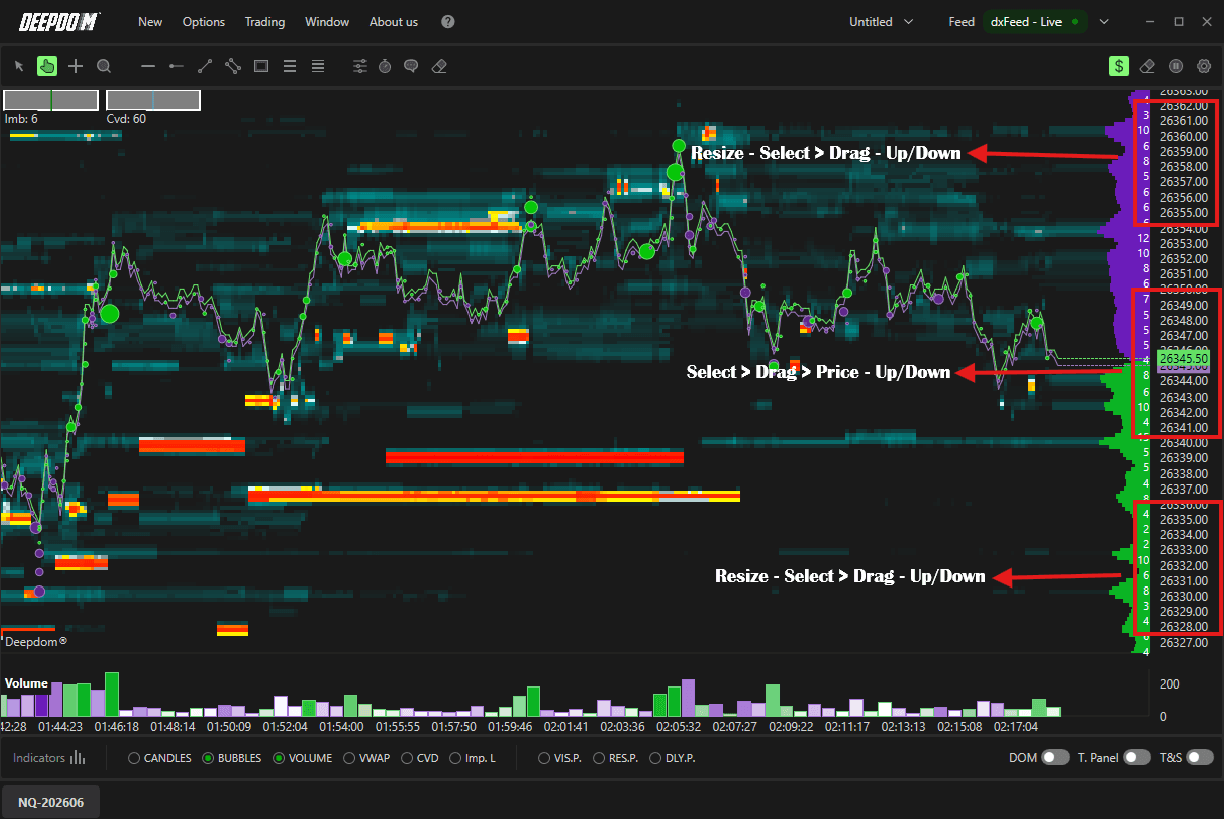
Move Axis — left-click anywhere on the Y-axis to drag it up or down
Size Axis — left-click anywhere on the Y-axis to resize the price scale
Annotations & Drawing Tools
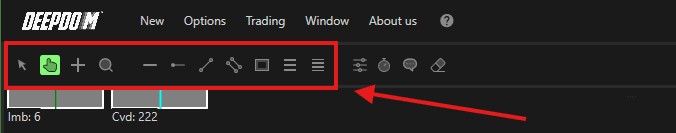
Use the Toolbar at the top of the chart to access drawing tools. From left to right:
Pointer — the default arrow cursor
Hand — lets you pan the chart in any direction
Crosshair — enables the crosshair cursor
Lens — zooms into a specific area of the chart
Horizontal Line — draws a horizontal line
Horizontal Radius — draws a horizontal radius
Line — draws a free line
Parallel Lines — draws a set of parallel lines
Rectangle — draws a rectangle
Retracements — inserts a Fibonacci retracement
Extensions — inserts Fibonacci projections
Customizing a Drawing Tool
Left-click to select the tool on the chart
Right-click to open its menu — here you can copy it, remove it, or change its properties
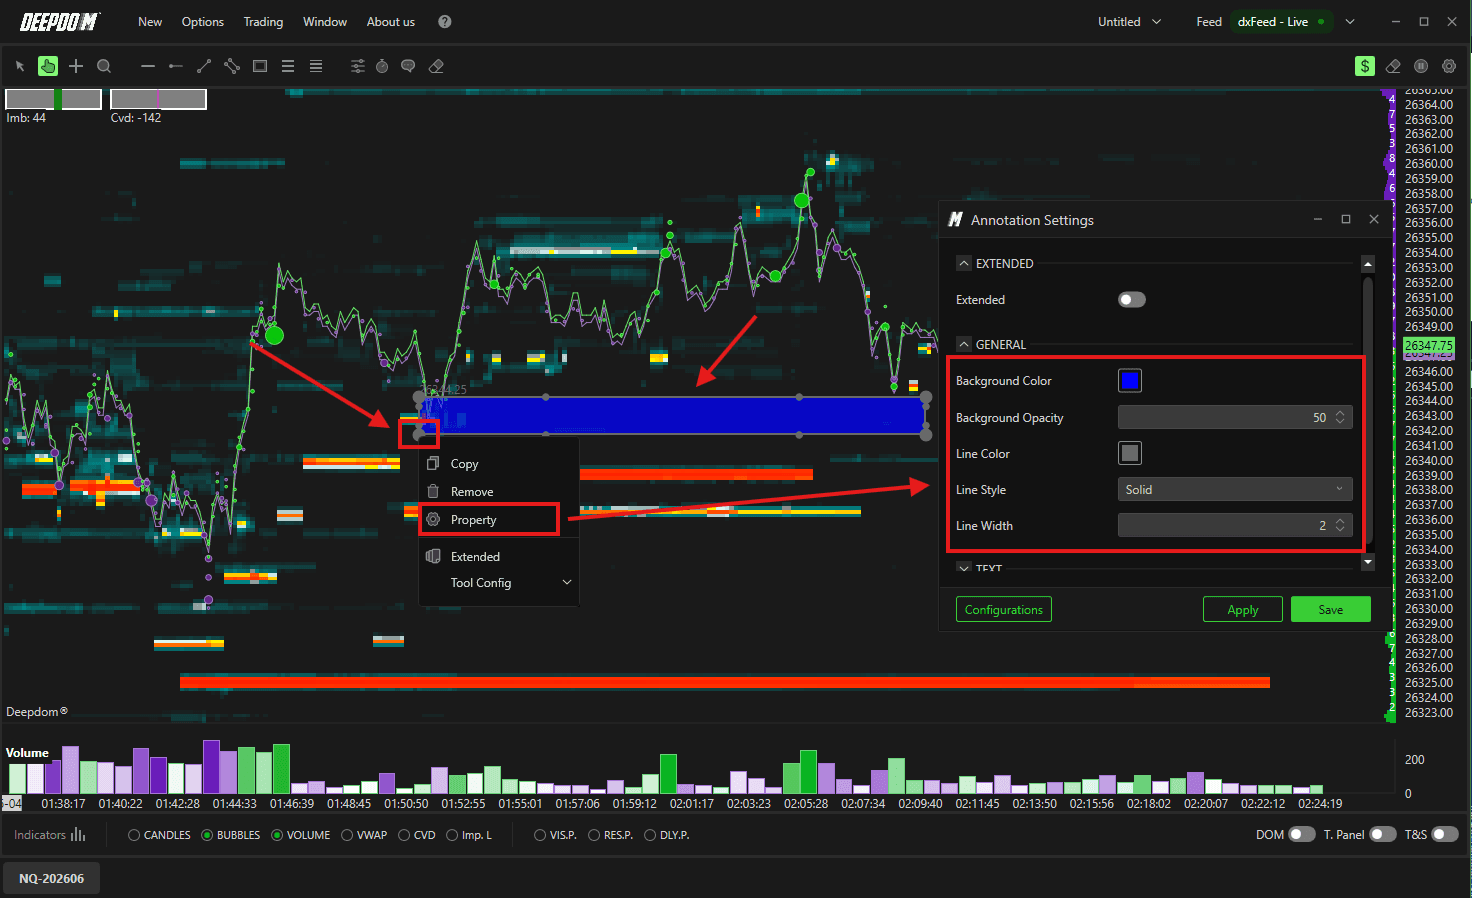
Once customized, save the configuration so you can quickly apply it again later
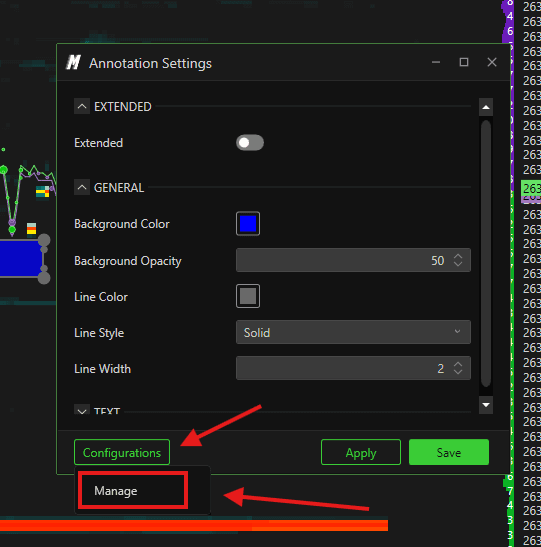
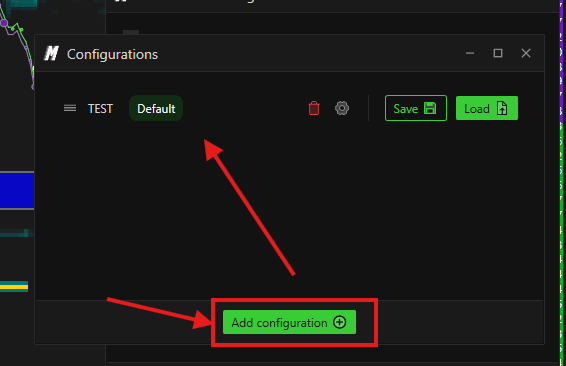
Saving & Recalling Configurations
Click Configurations at the bottom left and select Manage
Add a new configuration and give it a name
To recall it later, go to the CT menu and select from your saved configurations
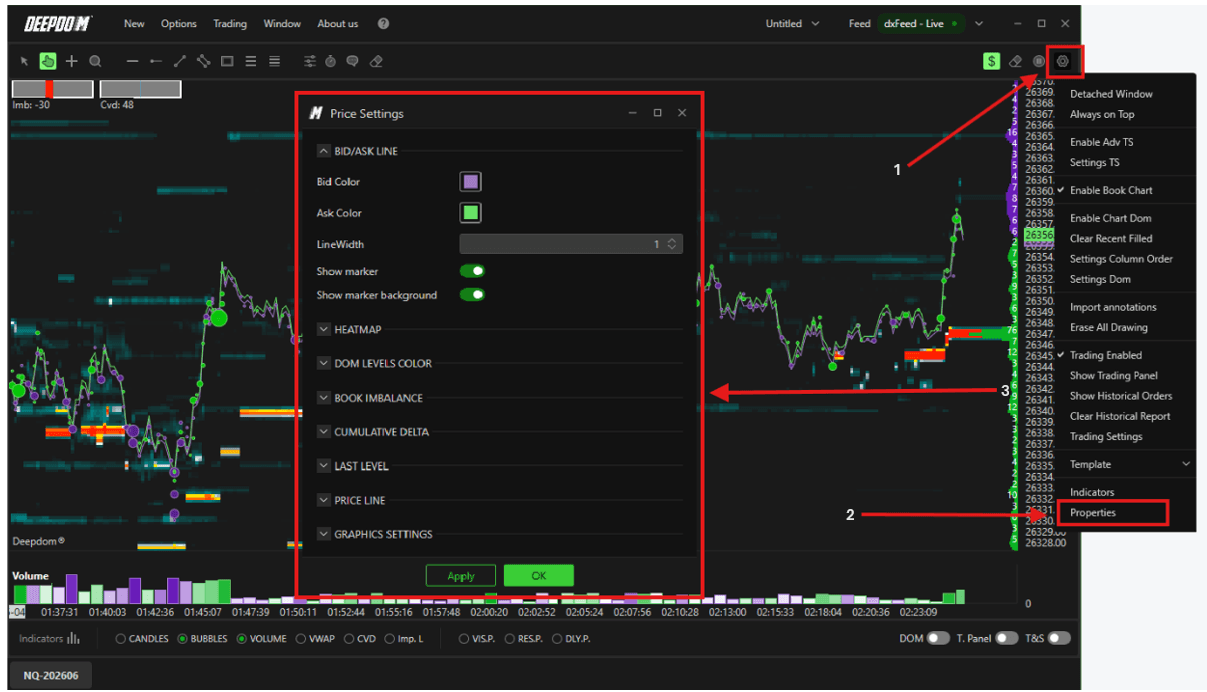
Settings
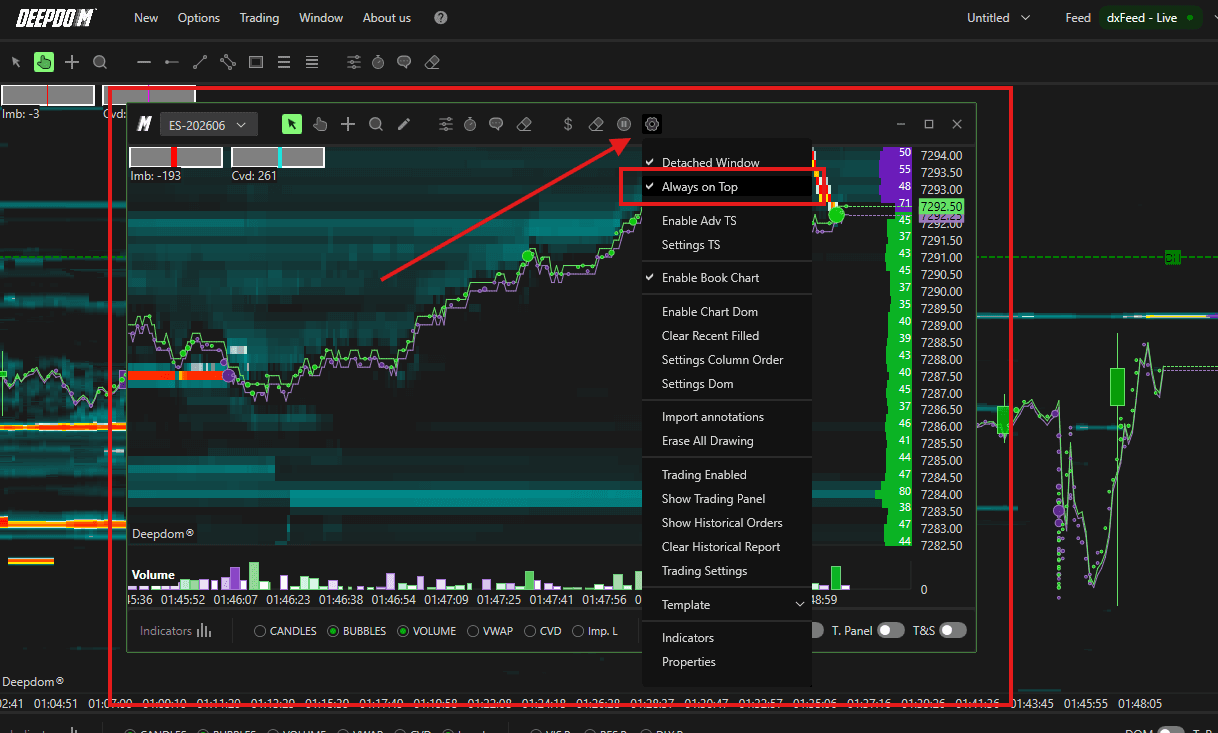
Click the Settings icon in the upper right corner of the chart to access the following options:
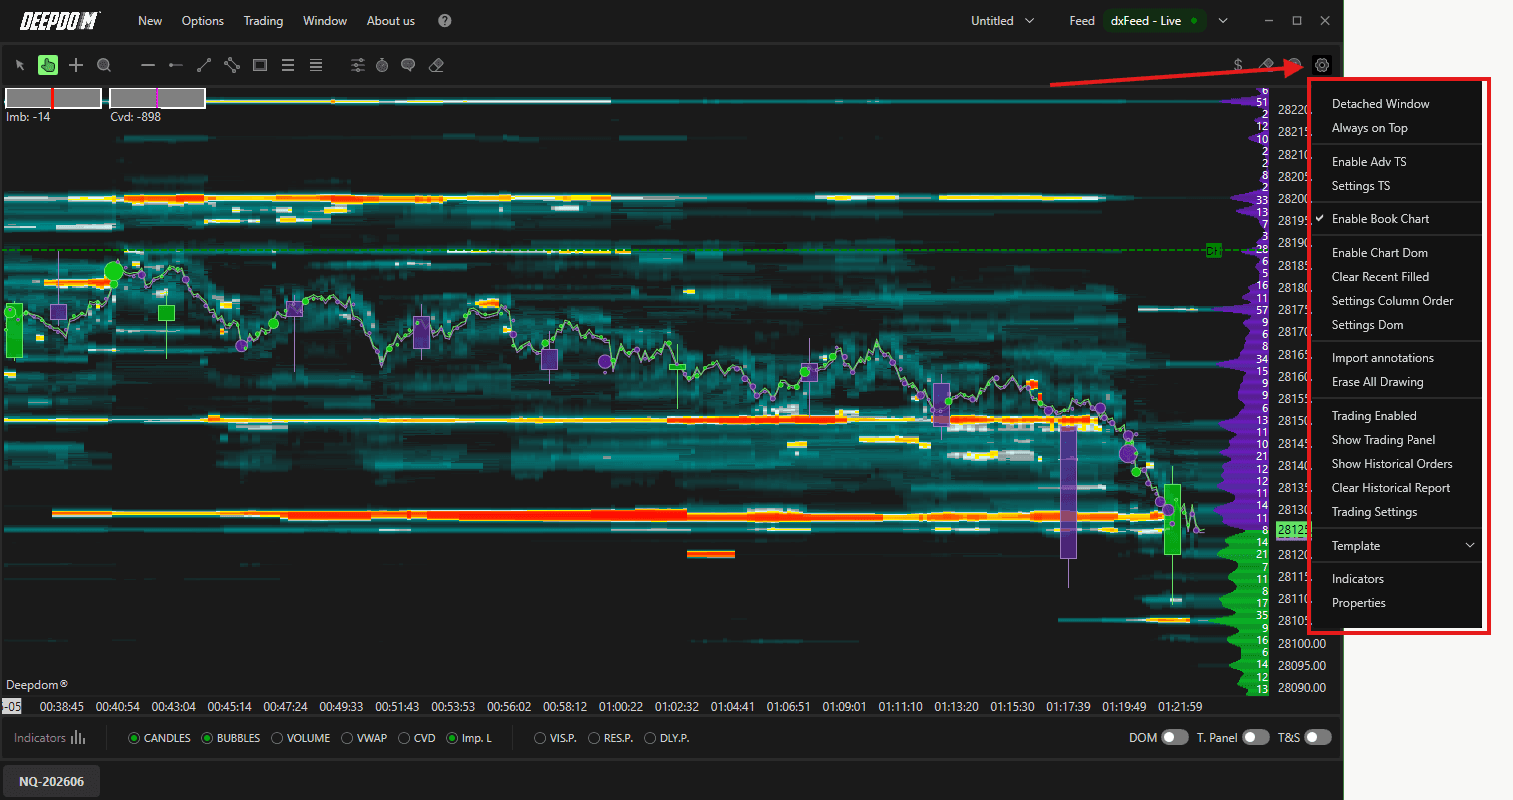
Detached Window Opens the chart in a separate independent window, detaching it from the main DeepDom interface. Useful when running multiple monitors and you want the chart on a different screen.
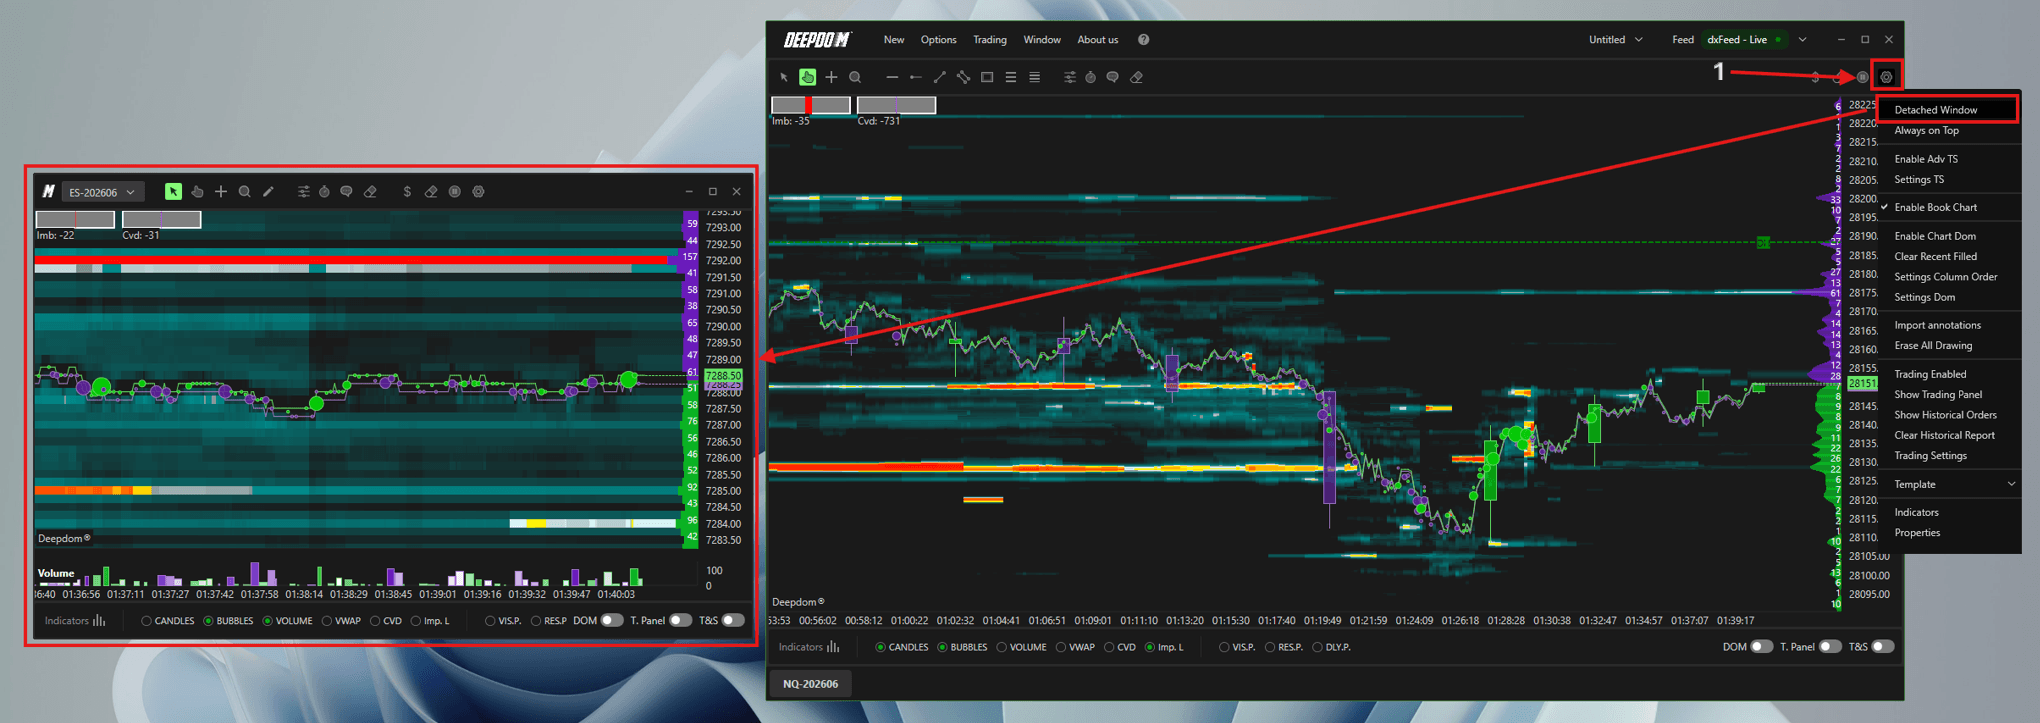
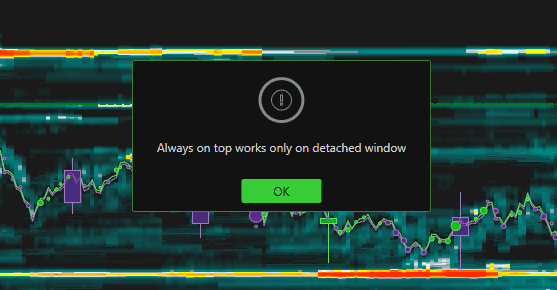
Always on Top Keeps the detached chart window always visible in the foreground, even when you click on other applications.
Error pop - When you turn this on Main Window's from Setting, It only works on detached chart window.
Enable Adv TS Enables the Advanced Time & Sales panel for the chart. For a full explanation, refer to the Adv. Time and Sales article.
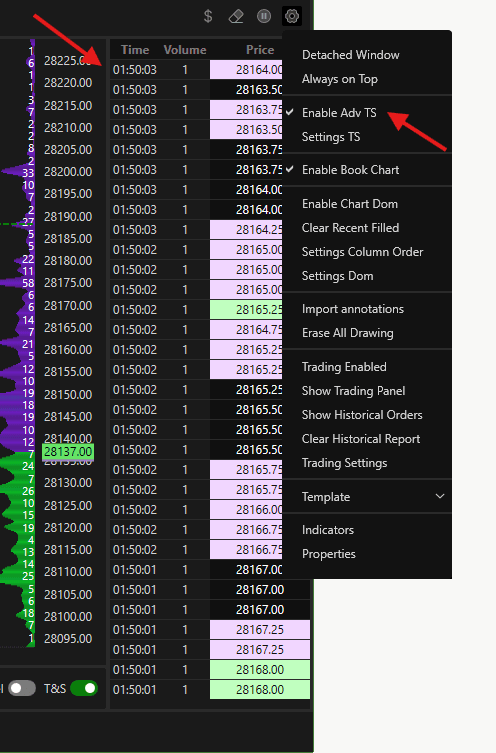
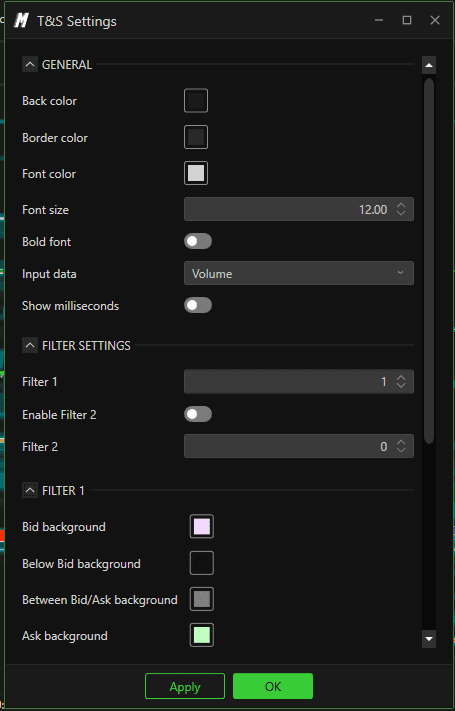
Settings TS Opens the settings for the Time & Sales panel, allowing you to configure its parameters.
Enable Book Chart Enables the Book Chart view directly on the chart.
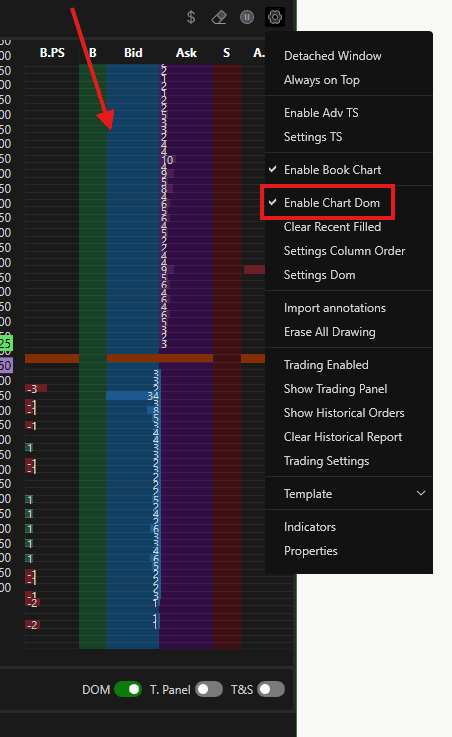
Enable Chart DOM Enables the Depth of Market (DOM) panel directly on the chart.
Clear Recent Filled Clears the recently filled orders displayed on the chart.
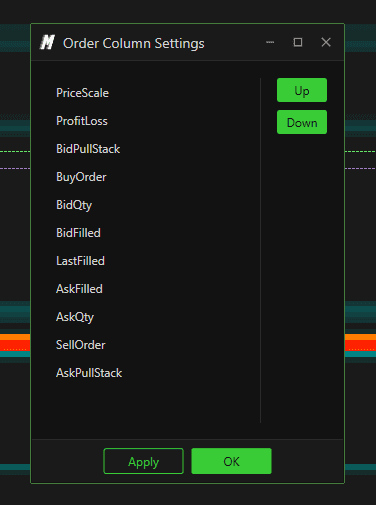
Settings Column Order Opens the settings to configure the column layout of the order display.
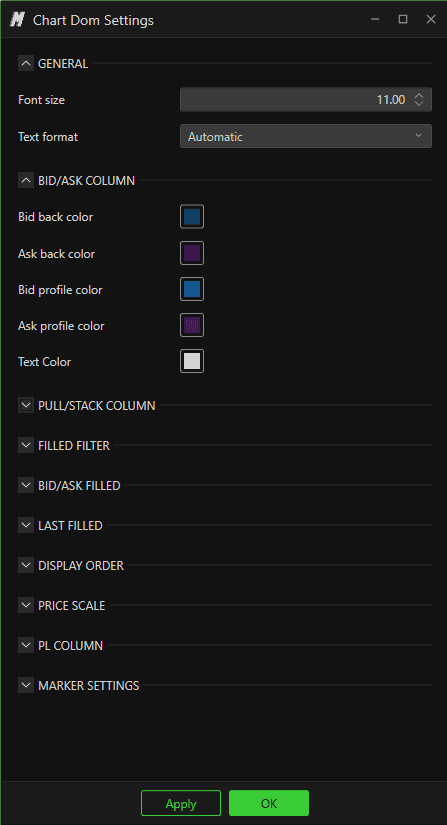
Settings DOM Opens the settings for the Chart DOM, allowing you to modify its parameters. For a full explanation, refer to the Adv. DOM article.
Import Annotations Lets you import previously saved annotations from VolSys directly into DeepDom — so you do not have to redraw your key levels manually.
Erase All Drawing Deletes all annotations and drawings currently on the chart in one click.
Trading Enabled Enables or disables trading functionality directly from the chart.
Show Trading Panel Shows or hides the Trading Panel on the chart.
Show Historical Orders Displays your historical orders directly on the chart for reference.
Clear Historical Report Clears the historical order report displayed on the chart.
Trading Settings Opens the trading configuration settings for the chart.
Template Save the current chart setup as a template or load a previously saved one. Useful when you want to quickly apply the same chart configuration to a different instrument.
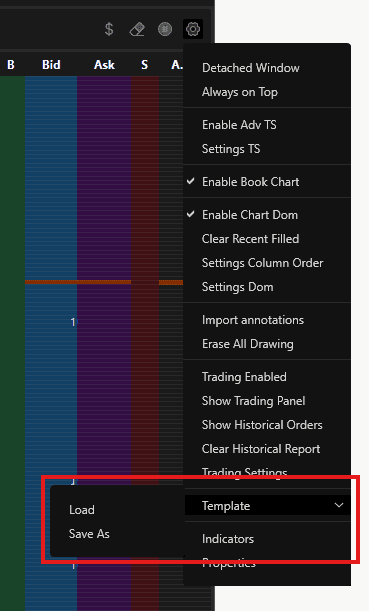
Indicators An alternative way to access the full list of available indicators — same as clicking the Indicators button in the lower left corner.
Properties Opens the Properties panel where you can customize the visual settings of the chart — including Heatmap colors, grouping mode, price line, and graphic settings.
Clicking in the upper right corner will be able to access the settings
Line Bid/Ask Change the color and thickness of the Bid and Ask lines on the chart.
Heatmap – Grouping Mode
Automatic — groups liquidity levels automatically. Recommended for lighter instruments such as NQ
None — shows liquidity at every individual price tick with no grouping
Heatmap – Color Mode
Multicolor — liquidity takes on different colors depending on volume, ranging from red for high liquidity to black for low liquidity
Custom — liquidity uses a fading color from a single color defined by you in the Bid Color and Ask Color settings
Color Levels – DOM Change the background and text color of Bid and Ask orders in the DOM.
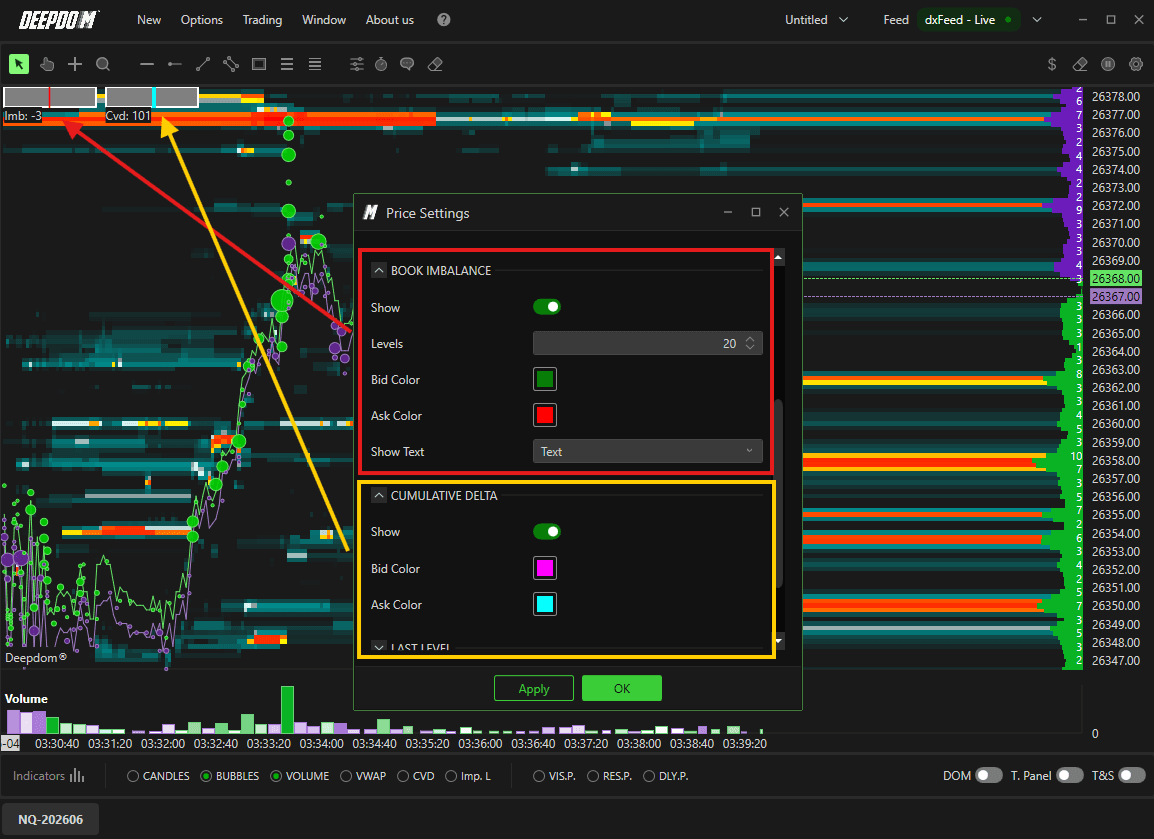
Imbalance Book Displays the book imbalance — the difference between contracts in Bid and contracts in Ask — across a number of levels defined by you.
Cumulative Delta Shows the cumulative delta for the portion of the chart currently visible on screen.
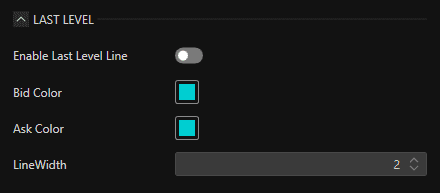
Last Level Enables a line depicting the 20th level in Bid and the 20th level in Ask on the chart.
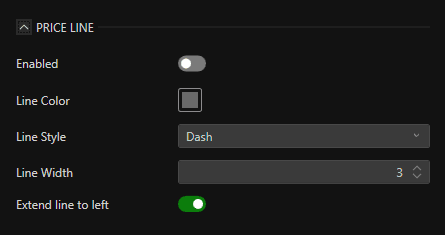
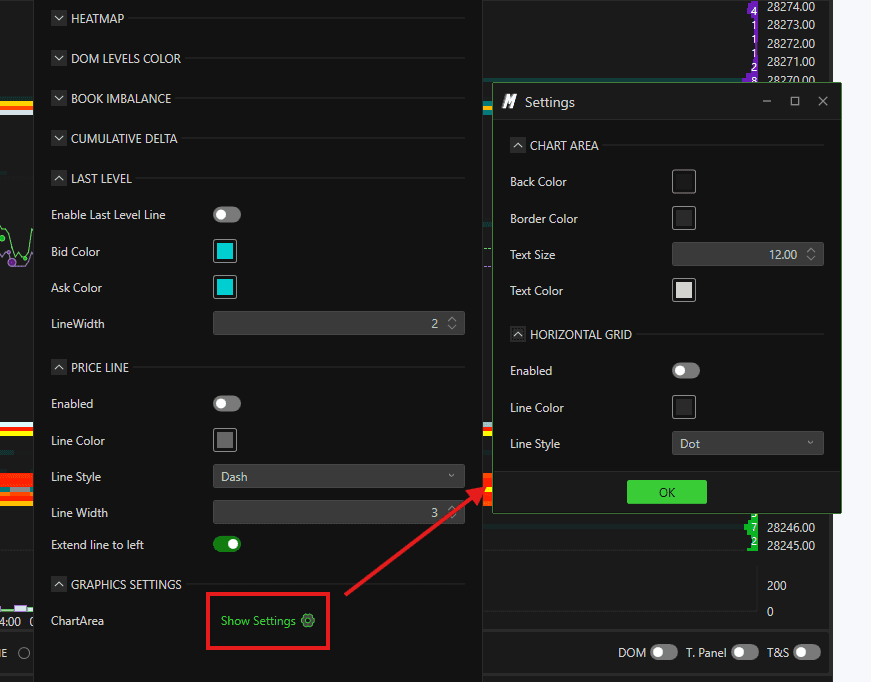
Price Line Enables the price line. You can change its color, style, and extend it to the left of the chart.
Graphic Settings Change the background color of the chart, enable or disable the grid, and define the grid color. Note that changing the grid color will also change the color of the crosshair.
Conclusion
The Heatmap gives you a complete view of both liquidity and market execution in one chart. Once you are comfortable navigating it, exploring the indicator and annotation tools will significantly deepen your understanding of Order Flow and market structure.
Still Having Trouble?
Our support team is available 24/7 and ready to help you with any issue you encounter.
When reaching out, please include:
A screenshot of the issue
A brief description of what you were trying to do
Support Ticket (Fastest Response) Visit www.deepcharts.com and create a support ticket directly on our website.
Email Support Reach us at support@deepcharts.com — please note that email responses may take a little longer than a support ticket.