Indicators
Updated:
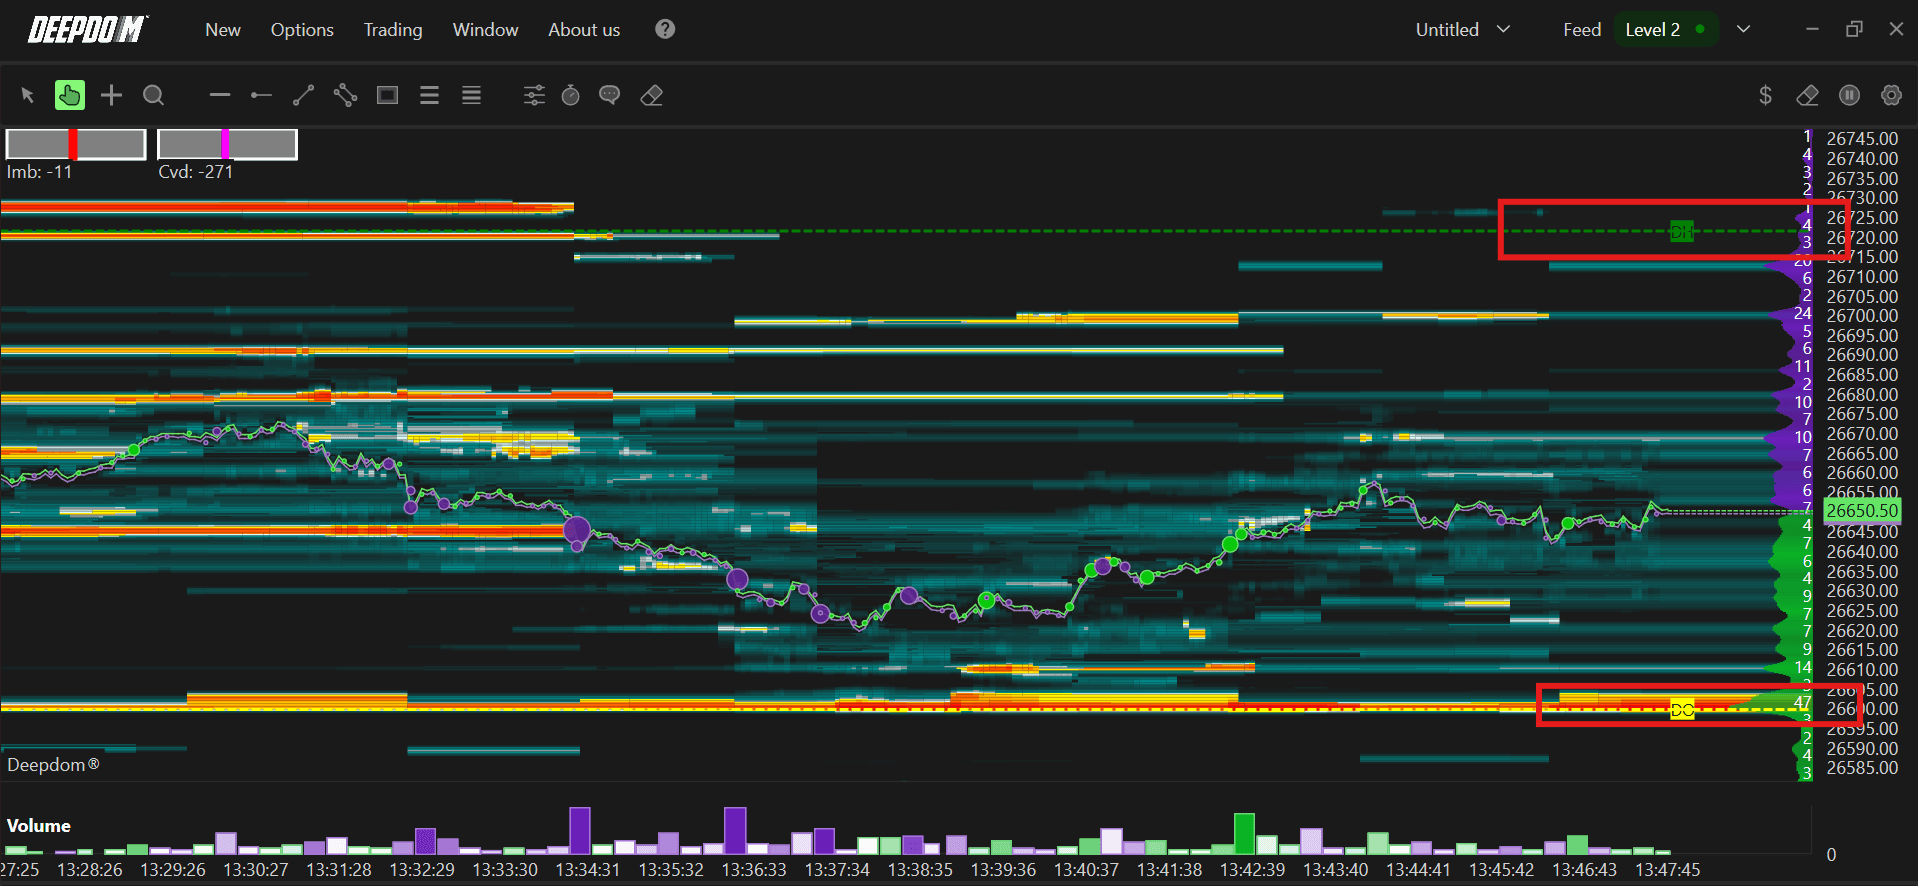
The Important Levels indicator draws dashed horizontal lines at the current session's high, low, and opening price, giving you a quick visual reference for key intraday levels.
What the Indicator Draws
Session High – highest traded price since the session open.
Session Low – lowest traded price since the session open.
Session Open – first traded price of the current session.
These levels update automatically as new highs/lows are made, ensuring the visual references remain accurate.
Settings of Use
Open the indicator configuration by clicking its settings icon. The window collects all display options and level controls.
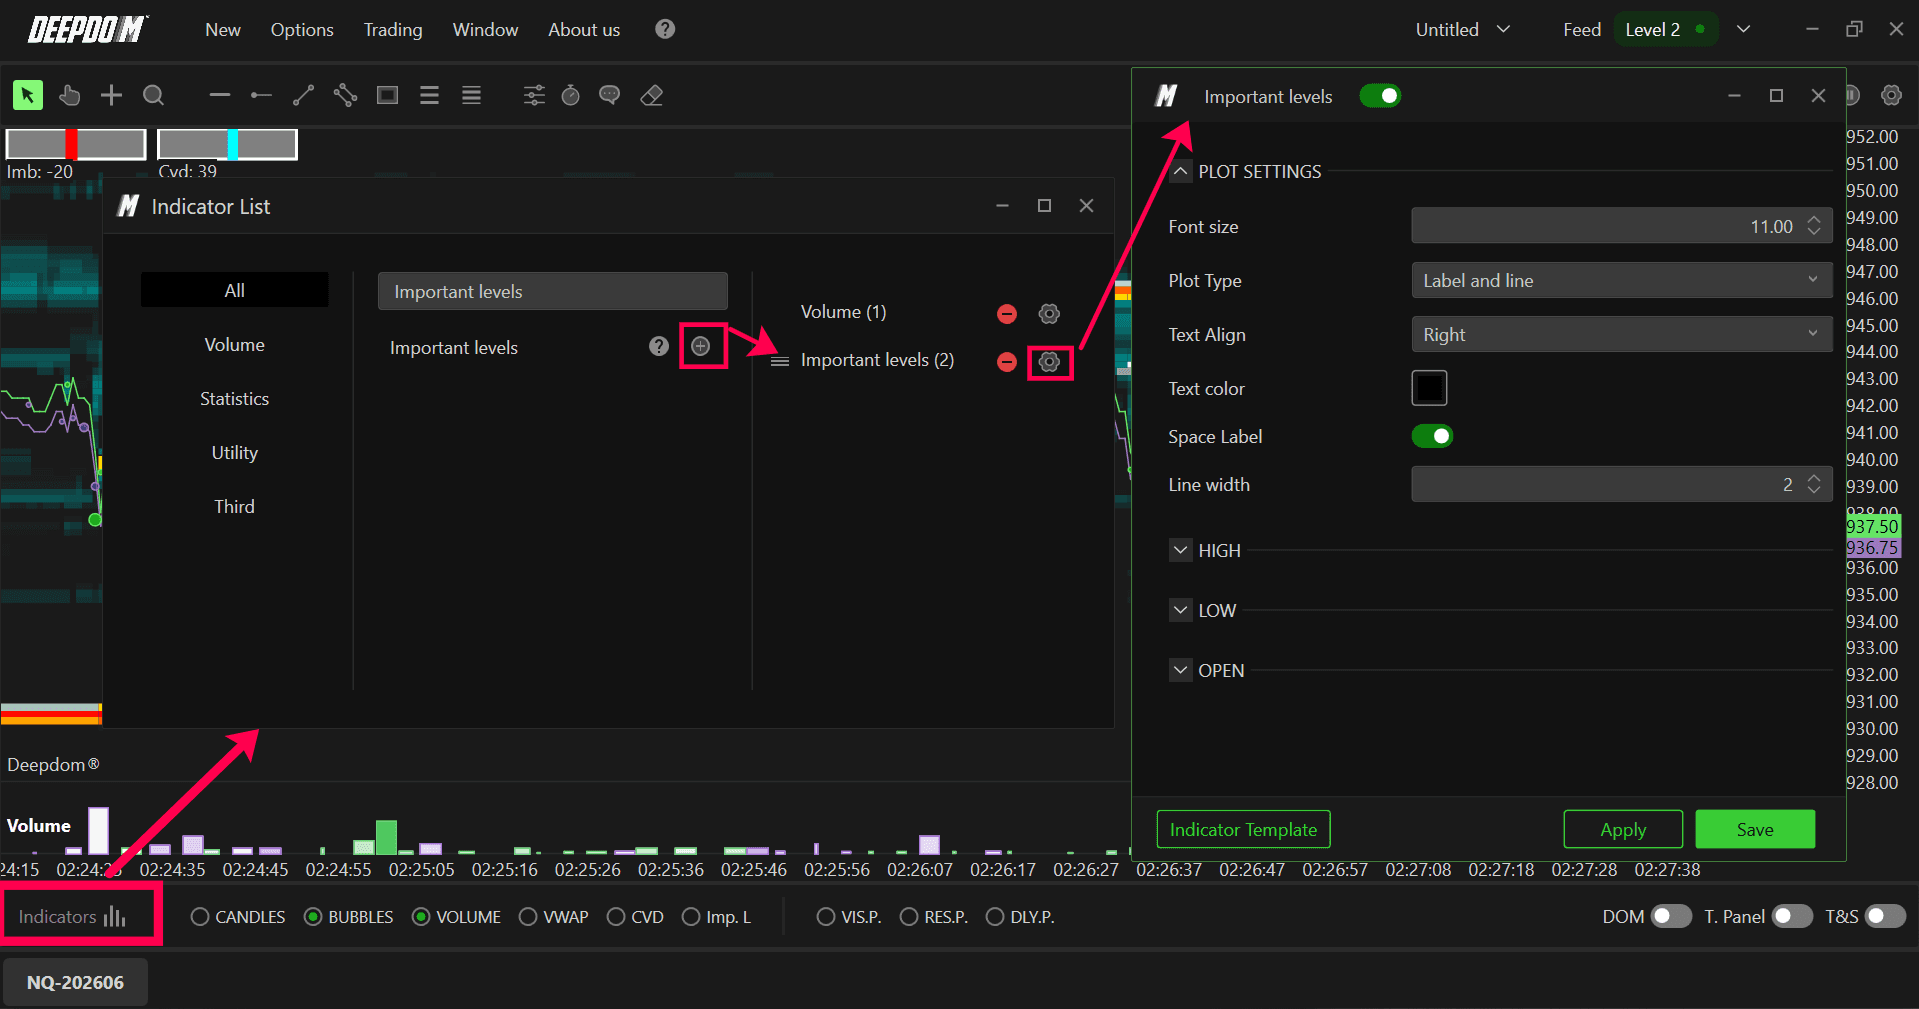
Plot Settings
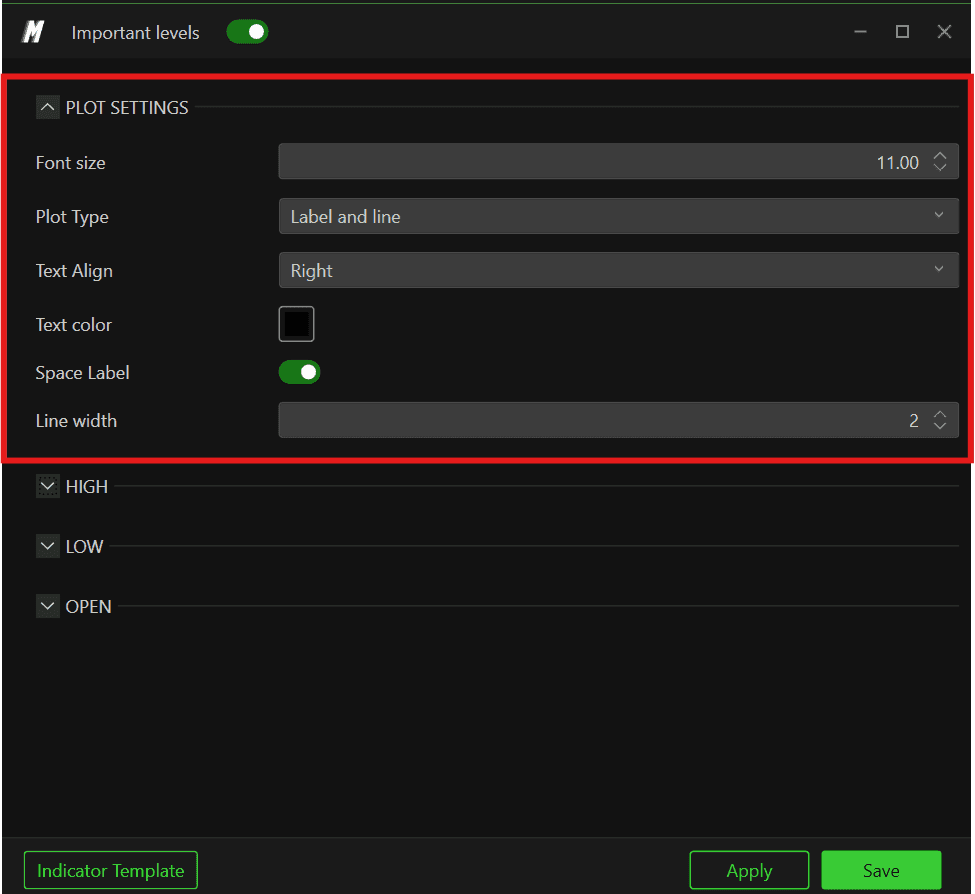
Font size – changes the size of the labels printed next to each level.
Plot type – choose whether to show only Text, only Line, or both Text and Line.
Text alignment – position text on the left or right side of the chart.
Text color – sets the label color.
Line thickness – controls the thickness of the horizontal lines.
High / Low / Open
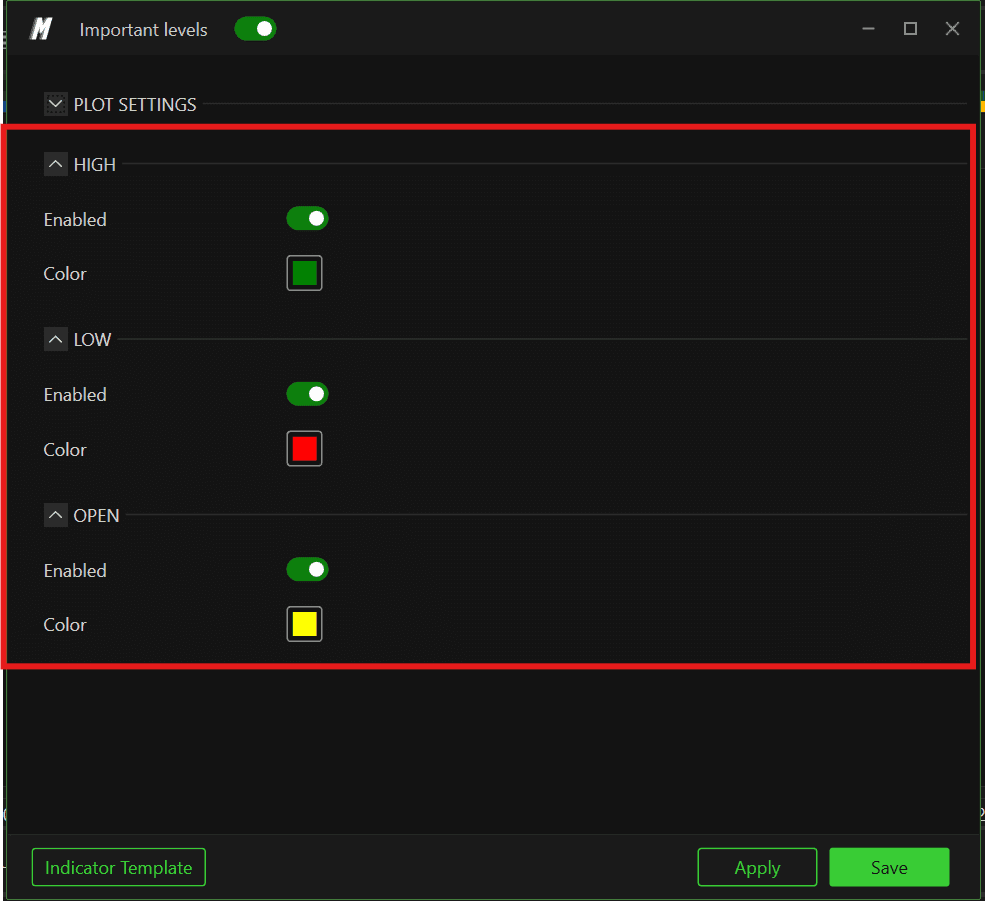
Use these options to enable or disable each level and customize its appearance:
High – session high.
Low – session low.
Open – session open price.
For each level you can change the line and text colors independently, ensuring that the most important levels stand out clearly on your DeepDom charts.
Using Important Levels in Trading
1. Breakout Logic
When price consolidates below the session high and then breaks out with strong volume and positive delta, Professional traders treat the old high as potential support on a retest. The indicator keeps this level clearly visible even if you change timeframe or zoom.
2. Mean‑Reversion Around the Open
The session open price is a natural magnet: in balanced days, price often oscillates around it. Fade setups around the open become easier to manage when the line is always visible across intraday charts.
3. Context for Order‑Flow Signals
Combining Important Levels with Delta/CVD and Deep Trades enables richer narratives, such as:
Large positive delta and Deep Trades exactly at session low → potential trap of late sellers.
Negative CVD accumulating while price holds just below session high → absorption signalling possible rejection.